Quantcast
Channel: GUI – Undocumented Matlab
Viewing all 75 articles
Browse latest View live

CheckboxList

$
0
0

Several years ago I blogged about using a checkbox-tree in Matlab. A few days ago there was a question on the Matlab Answers forum asking whether something similar can be done with Matlab listboxes, i.e. add checkboxes next to each list item. There are actually several alternatives for this and I thought this could be a good opportunity to discuss them:

MathWorks CheckBoxList

MathWorks CheckBoxList


The HTML image variant

The simplest alternative is to use small icon images checked and unchecked as part of the listbox item labels. As I explained last year, listboxes (like all other Matlab uicontrols that rely on underlying Java Swing components), support HTML and can be formatted using HTML images. For example:

Matlab listbox with HTML image icons

Matlab listbox with HTML image icons

In order to check/uncheck items in the listbox, we can trap the underlying Java component’s MouseClickedCallback using the findjobj utility:

% Assume checked.gif, unchecked.gif are 16x16 icons
prefix = ['<html><img src="file:///' strrep(path_of_icon_files),'\','/') '/unchecked.gif" height=16 width=16 />'];
sampleData = strcat(prefix, {'first', 'Second', 'Third', 'and last'});  % all items are unchecked at first
hListbox = uicontrol(...);
jScrollPane = findjobj(hListbox);
jListbox = handle(jScrollPane.getViewport.getView, 'CallbackProperties');
jListbox.MouseClickedCallback = {@mouseClickedFcn,hListbox};
 
function mouseClickedFcn(jListbox, jEventData, hListbox)
   % Get the clicked item and row index
   clickedX = jEventData.getX;
   clickedY = jEventData.getY;
   if clickedX > 15,  return;  end  % did not click a checkbox so bail out
   clickedRow = jListbox.locationToIndex(java.awt.Point(clickedX,clickedY)) + 1;  % Matlab row index = Java row index+1
   if clickedRow <= 0,  return;  end  % clicked not on an item - bail out
   strs = get(hListbox,'String');
   clickedItem = strs{clickedRow};
 
   % Switch the icon between checked.gif <=> unchecked.gif
   if strfind(clickedItem,'unchecked')
       strs{clickedRow} = strrep(clickedItem,'unchecked','checked');
   else
       strs{clickedRow} = strrep(clickedItem,'checked','unchecked');
   end
   set(hListbox,'String',strs);  % update the list item
end

Finally, when we process the selected list item(s), we can simply check whether they contain ‘unchecked.gif’ or ‘checked.gif’. Pretty straight-forward stuff.

MathWorks CheckBoxList

com.mathworks.mwswing.checkboxlist.CheckBoxList is a JList extension that displays a list of labels in a list with a checkbox next to each label. The labels’ checkboxes can be set, unset and queried using methods supplied by the CheckBoxList class or its com.mathworks.mwswing.checkboxlist.DefaultListCheckModel model:

% First create the data model
jList = java.util.ArrayList;  % any java.util.List will be ok
jList.add(0,'First');
jList.add(1,'Second');
jList.add(2,'Third');
jList.add(3,'and last');
 
% Next prepare a CheckBoxList component within a scroll-pane
jCBList = com.mathworks.mwswing.checkboxlist.CheckBoxList(jList);
jScrollPane = com.mathworks.mwswing.MJScrollPane(jCBList);
 
% Now place this scroll-pane within a Matlab container (figure or panel)
[jhScroll,hContainer] = javacomponent(jScrollPane,[10,10,80,65],gcf);
 
% Set the listbox to respond to click events
jhCBList = handle(jCBList, 'CallbackProperties');
set(jhCBList, 'ValueChangedCallback', @myMatlabCallbackFcn);
 
% Update some items' state programmatically
jCBModel = jCBList.getCheckModel;
jCBModel.checkAll;
jCBModel.uncheckIndex(1);
jCBModel.uncheckIndex(3);

This results in the following image:

MathWorks CheckBoxList

MathWorks CheckBoxList

We can query the various checked/unchecked states programmatically:

>> jCBList.getCheckedValues
ans =
[First, Third]
 
>> jCBList.getCheckedIndicies'
ans =
           0       2
 
>> jCBModel.isIndexChecked(0)
ans =
     1    % =true

JIDE’s CheckBoxList

There is also an unrelated JIDE equivalent: com.jidesoft.swing.CheckBoxList. Readers are referred to the JIDE documentation for additional details.

The basic idea is the same as with the MathWorks CheckBoxList: we create the data model, then create a CheckBoxList component within a JScrollPane and place this onscreen using the javacomponent function. We can then modify or query the data model programmatically, and set various callback functions to process user events.

% Prepare the data model as above
 
% Now display onscreen:
jCBList = com.jidesoft.swing.CheckBoxList(jList.toArray)
jScrollPane = com.mathworks.mwswing.MJScrollPane(jCBList);
[jhScroll,hContainer] = javacomponent(jScrollPane, [120,10,80,65], gcf);
 
% Do some programmatic updates:
jCBList.selectAll;  % reverse: jCBList.selectNone
jCBList.setCheckBoxListSelectedIndices([0,2]);

The appearance is very similar to the MathWorks CheckBoxList, except that JIDE’s CheckBoxList has slightly less space between the list rows, and between the checkboxes and labels. The main difference between these components is not in their visual appearance but rather in their supported functionalities (internal methods) – some people might prefer the MathWorks component, others might like JIDE better. To see these functionalities, use my uiinspect and/or checkClass utilities.

For additional information on the MathWorks and JIDE components, and how to investigate and customize them, see Chapter 5 of my Matlab-Java programming book.

ActiveX and other alternatives

If you are running on Windows, you could use ActiveX controls that implement checkbox list functionality. One such control that is pretty standard is Microsoft’s MSComctlLib.ListViewCtrl.2. I showed an example of ListViewCtrl usage a few years ago, and readers are referred there for details. Here is the end result:

Sorted ListViewCtrl

Sorted ListViewCtrl

Granted, this is more of a table having a checkbox column than a listbox, but you can easily make the ListViewCtrl have only a single column.

In addition to this standard ListViewCtrl control, there are plenty of other third-party ActiveX or Java controls that can more-or-less easily be integrated in our Matlab GUI. The drawback of ActiveX is that it only works on a limited set of platforms, whereas the Java-based components (either MathWorks or JIDE) work on all Matlab installations.

Anyway, don’t let anyone say ever again that Matlab GUI is boring. It is not. It is only limited by our imagination and our willingness to find and customize components that implement our requirements. There are plenty of alternatives out there, we just need to reach out and use them. If you can’t do it yourself, you could always use an external consultant like me to help you.

 
Related posts:
  1. Customizing listbox & editbox scrollbars Matlab listbox and multi-line editbox uicontrols have pre-configured scrollbars. This article shows how they can be customized....
  2. Tri-state checkbox Matlab checkboxes can easily be made to support tri-state functionality....
  3. Color selection components Matlab has several internal color-selection components that can easily be integrated in Matlab GUI...
  4. Date selection components The JIDE package, pre-bundled in Matlab, contains several GUI controls for selecting dates - this article explains how they can be used...
 

Customizing listbox/combobox items

$
0
0

Last week I wrote about using a variety of techniques to customize listbox items with an attached checkbox icon. Some of these methods used a standard Matlab listbox uicontrol, others used other controls. Today I wish to extend the discussion and show how Matlab listbox and combobox (pop-up) items can be customized in a variety of ways.

To add icons to listbox/combobox items, we could use standard HTML, as I’ve shown last week. This is the simplest method, requires no Java knowledge, and it usually works well. The problem is that when a listbox/combobox has numerous items (hundreds or more), it may start getting sluggish. In such case it is faster to use a dedicated Java cell-renderer that sets the icon, font, colors, tooltip and other aspects on an item-by-item basis. This runs faster and enables far greater customizability than what is possible with HTML. The drawback is that it requires some Java programming. No free lunch…

Listbox and combobox cell-renderers need to extend javax.swing.ListCellRenderer, similarly to uitable cell-renderers. This is basically a simple Java class that minimally contains just an empty constructor and a getListCellRendererComponent() method with a predefined signature. getListCellRendererComponent() is automatically called by the Swing render engine separately for each listbox item, and gets as input args a JList reference, the item value (typically a string), an integer list index, a boolean flag indicating whether the item is currently selected, and another flag indicating whether the item is currently in focus. getListCellRendererComponent() uses these parameters to customize and return a java.awt.Component, which is typically (but not necessarily) a standard Swing JLabel.

Here is a simple example that displays a folder of icon files in a Matlab listbox and combobox. Each item is the filename, with a customization that if the file is an icon, then this icon is displayed next to the file name, otherwise the name appears in red italic without an icon. For illustration, we’ll use Matlab’s builtin icons folder: %matlabroot%/toolbox/matlab/icons/:

Custom listbox cell-renderer    Custom combobox cell-renderer

Creating the cell renderer

We start by creating a custom ListCellRenderer. Place the following code in a file called LabelListBoxRenderer.java:

import java.awt.*;
import javax.swing.*;
import java.util.Hashtable;
 
public class LabelListBoxRenderer extends JLabel implements ListCellRenderer
{
    private String folderPath;
    private final Hashtable<String,ImageIcon> iconsCache = new Hashtable<String,ImageIcon>();
 
    // Class constructors
    public LabelListBoxRenderer() {
        setOpaque(true);
        setHorizontalAlignment(LEFT);
        setVerticalAlignment(CENTER);
    }
    public LabelListBoxRenderer(String folderPath) {
        this();
        this.folderPath = folderPath;
    }
 
    // Return a label displaying both text and image.
    public Component getListCellRendererComponent(
            JList list,
            Object value,
            int index,
            boolean isSelected,
            boolean cellHasFocus)
    {
        String label = value.toString();
        setFont(list.getFont());
        if (isSelected) {
            // Selected cell item
            setBackground(list.getSelectionBackground());
            setForeground(list.getSelectionForeground());
        } else {
            // Unselected cell item
            setBackground(list.getBackground());
            setForeground(list.getForeground());
        }
        try {
            String iconFname = (folderPath + "/" + label).replace('\\', '/');
            ImageIcon icon = getFileIcon(iconFname);
            setIcon(icon);
            if (icon.getIconWidth() > 0) {
                // Cell item is a valid icon filename
                list.setToolTipText(iconFname + " (" + icon.getIconWidth() + " x " + icon.getIconHeight() + ")");
            } else {
                // Cell item is not an icon filename
                list.setToolTipText(iconFname + " (not an icon)");
                setFont(getFont().deriveFont(Font.ITALIC));
                setForeground(Color.red);
            }
        } catch (Exception e) {
            list.setToolTipText(e.getMessage());
        }
        //System.out.println(index + ": " + label);  // debug console printout
        setText(label);
        return this;
    }
 
    // Modify the folder path (default = current folder)
    public void setFolderPath(String folderPath) {
        this.folderPath = folderPath;
    }
 
    // Lazily load the file icons only as needed, later reuse cached data
    private ImageIcon getFileIcon(String filename) {
        ImageIcon icon;
        if (iconsCache.containsKey(filename)) {
            // Reuse cached data
            icon = iconsCache.get(filename);
        } else {
            // Lazily load the file icons only as needed
            icon = new ImageIcon(filename);
            iconsCache.put(filename, icon);  // store in cache for later use
        }
        return icon;
    }
}

In the code above, I’ve cached the ImageIcons, so that the actual disk file is only accessed once rather than repeatedly whenever the cell needs to be rendered. For even improved performance, we could also cache the tooltips and derived italic font so that they would not be regenerated each time (note that the list’s font is not the same as the cell component’s font) – I will leave this as an exercise to the reader.

Next, compile this file (using the standard javac compiler or any Java IDE), ensuring that you target a JVM compatible with your Matlab (JVM 5 will work on R14SP2 onward, 6 on R2007b onward, and 7 only on R2013b or newer). For convenience, both the source and compiled files for the LabelListBoxRenderer class can be downloaded here: LabelListBoxRenderer.java, LabelListBoxRenderer.class.

Using the cell-renderer in Matlab listboxes

Now that we have a custom cell renderer, we should add the LabelListBoxRenderer.class file to Matlab’s Java classpath using the javaaddpath function and then use this class in Matlab:

% Create the Matlab listbox
iconsFolder = fullfile(matlabroot, 'toolbox/matlab/icons');
files = dir(iconsFolder);
hListbox = uicontrol('Style','list', 'String',{files.name}, 'Position',[10,10,120,150]);
 
% Find the uicontrol's underlying Java component
jScroll = findjobj(hListbox);
jListbox = jScroll.getViewport.getView;
 
% Update the listbox's cell-renderer
javaaddpath 'C:\Yair\Undocumented Matlab\Work\'   % location of my LabelListBoxRenderer.class
jRenderer = LabelListBoxRenderer(iconsFolder);
jListbox.setCellRenderer(jRenderer);
 
% Give the icons some space...
jListbox.setFixedCellHeight(18);

This results in the nice-looking listbox whose screenshot appears above. Wasn’t too painful was it?

Using the cell-renderer in Matlab combo-boxes

Customizing Matlab combo-boxes is just as easy, and uses the same LabelListBoxRenderer class:

% Create the Matlab combobox
iconsFolder = fullfile(matlabroot, 'toolbox/matlab/icons');
files = dir(iconsFolder);
hCombobox = uicontrol('Style','popup', 'String',{files.name}, 'Position',[10,10,120,150]);
 
% Find the uicontrol's underlying Java component
jCombobox = findjobj(hCombobox);  % no scroll-pane for combos
 
% Update the combobox's cell-renderer
javaaddpath 'C:\Yair\Undocumented Matlab\Work\'   % location of my LabelListBoxRenderer.class
jRenderer = LabelListBoxRenderer(iconsFolder);
jCombobox.setRenderer(jRenderer);  % Note: not setCellRenderer()
 
% Give the icons some space...
jCombobox.setFixedCellHeight(18);
 
% Make the drop-down list shorter than the default (=20 items)
jCombobox.setMaximumRowCount(8);

For additional aspects of listbox and combobox customizations, refer to sections 6.6 and 6.7 of my Matlab-Java programming book.

 
Related posts:
  1. Customizing menu items part 3 Matlab menu items can easily display custom icons, using just a tiny bit of Java magic powder. ...
  2. Customizing listbox & editbox scrollbars Matlab listbox and multi-line editbox uicontrols have pre-configured scrollbars. This article shows how they can be customized....
  3. Customizing menu items part 2 Matlab menu items can be customized in a variety of useful ways using their underlying Java object. ...
  4. Listbox layout customization Matlab's listbox layout can be modified to display multiple item columns and different inter-cell margins. ...
 

Customizing combobox popups

$
0
0

Last week I explained how we can use display custom items in a standard Matlab combobox (popup/dropdown), using its underlying Java component. Today I will show how we can use this Java component for other nice customizations of the combobox’s popup:

Underlying Java component

The first step is to find the underlying Java component of the Matlab combobox (aka popup) uicontrol. This is done using my findjobj utility:

% Create the Matlab combobox
items = {'<HTML><FONT color="red">Hello</Font></html>', 'world', ...
         '<html><font style="font-family:impact;color:green"><i>What a', ...
         '<Html><FONT color="blue" face="Comic Sans MS">nice day!</font>'};
hCombobox = uicontrol('Style','popup', 'Position',[10,100,120,20], 'String',items);
 
% Find the uicontrol's underlying Java component
jCombobox = findjobj(hCombobox);

For findjobj to work, the Matlab uicontrol needs to be visible – it will not have a Java component before it is rendered onscreen for the first time. If everything is successful, jCombobox should now be a reference to the underlying om.mathworks.hg.peer.ComboboxPeer$MLComboBox Java component, which is an extension of the standard Swing JComboBox, as can be seen using my checkClass utility:

>> jCombobox.checkClass
 
private com.mathworks.hg.peer.ComboboxPeer$MLComboBox (uiinspect)
 
Superclass: com.mathworks.mwswing.MJComboBox
Superclass: javax.swing.JComboBox
 
Methods in JComboBox missing in ComboboxPeer$MLComboBox:
   JComboBox()
   JComboBox(java.lang.Object[])
   JComboBox(java.util.Vector)
   JComboBox(javax.swing.ComboBoxModel)
 
Methods in ComboboxPeer$MLComboBox missing in JComboBox:
   ComboboxPeer$MLComboBox(com.mathworks.hg.peer.ComboboxPeer)
   isPopupWidthConstrained() : boolean
   isTipWhenTruncatedEnabled() : boolean
   processEvent(java.awt.AWTEvent)
   registerWithKeyBindingManager(com.mathworks.mwswing.binding.KeyBindingManager, java.lang.String)
   setConstrainPopupWidth(boolean)
   setEditorColumnCount(int)
   setTipWhenTruncatedEnabled(boolean)
 
Methods inherited & modified by ComboboxPeer$MLComboBox:
   getInsets() : java.awt.Insets
   setBackground(java.awt.Color)
   updateUI()
 
Interfaces in JComboBox missing in ComboboxPeer$MLComboBox:
   java.awt.ItemSelectable
   java.awt.event.ActionListener
   javax.accessibility.Accessible
   javax.swing.event.ListDataListener

We shall now use three properties of this object to customize the control’s popup:

MaximumRowCount

The MaximumRowCount numeric property (default=20) sets the maximal number of drop-down items to display in the visible portion of the popup, before requiring a scrollbar. This basically controls the popup’s height:

% Get the current MaximumRowCount value 
numItems = get(jCombobox, 'MaximumRowCount');
numItems = jCombobox.MaximumRowCount;     % equivalent - access the property directly
numItems = jCombobox.getMaximumRowCount;  % equivalent - use Java's accessor method (best way)
 
% Set the MaximumRowCount value
set(jCombobox,'MaximumRowCount',3);
jCombobox.MaximumRowCount = 3;      % equivalent - access the property directly
jCombobox.setMaximumRowCount(3);    % equivalent - use Java's accessor method (best way)

MaximumRowCount=20 (default)

MaximumRowCount=20
(default)

MaximumRowCount=3

MaximumRowCount=3
 

MaximumRowCount=2

MaximumRowCount=2
 

Note that MaximumRowCount is a Matlab extension to the standard Swing JComboBox, so if we use a JComboBox directly in our code (using javacomponent) we will not have this feature. Creating the ComboboxPeer$MLComboBox component instead is possible, but is beyond the scope of this article, because MathWorks chose for this class not to have JComboBox‘s standard constructors but rather only a constructor that accepts a com.mathworks.hg.peer.ComboboxPeer object.

PopupVisible

The PopupVisible property (default=false) is a boolean flag which controls whether the popup window is currently (or should be) displayed. If this property is updated, then the focus is automatically transferred to the popup window for easy item selection using the keyboard (up/down/enter keys). There are also equivalent convenience methods showPopup()/hidePopup():

% Is the popup currently shown?
isShown = get(jCombobox, 'PopupVisible');
isShown = jCombobox.PopupVisible;     % equivalent - access the property directly
isShown = jCombobox.isPopupVisible;   % equivalent - use Java's accessor method (best way)
 
% Display the popup
set(jCombobox,'PopupVisible',true);   % NOT 'on' - this is a Java property, not a Matlab HG one!
jCombobox.PopupVisible = true;        % equivalent - access the property directly
jCombobox.setPopupVisible(true);      % equivalent - use Java's accessor method (best way)
jCombobox.showPopup();                % equivalent - use Java's direct method
 
% Hide the popup
set(jCombobox,'PopupVisible',false);  % NOT 'off' - this is a Java property, not a Matlab HG one!
jCombobox.PopupVisible = false;       % equivalent - access the property directly
jCombobox.setPopupVisible(false);     % equivalent - use Java's accessor method (best way)
jCombobox.hidePopup();                % equivalent - use Java's direct method

Note that PopUpVisible is not a Matlab extension – it exists in the original Swing JComboBox. Unfortunately, it was not included in the list of properties that are exposed to the user by the high-level Matlab uicontrol, so we need to use the underlying Java component.

On a Windows platform the PopupVisible property is toggled, thereby showing/hiding the popup window, whenever the user clicks <Alt-Up> or <Alt-Down> when the combo-box has focus.

PopupWidthConstrained

The PopupWidthConstrained property (default=false) is a boolean flag which is another Matlab extension to the standard Swing JComboBox. It is apparently used to constrain the width of the drop-down list to the width of the text field. MathWorks took the trouble to add this feature because Swing JComboBox‘s width is constrained, causing a difficulty in distinguishing between popup values when the control is relatively narrow; Matlab’s MJComboBox‘s default unconstrained behavior is much more user-friendly:

PopupWidthConstrained=false (default)

PopupWidthConstrained=false
(default)

PopupWidthConstrained=true

PopupWidthConstrained=true
 

Note that the PopupWidthConstrained property’s read accessor methods is the expected isPopupWidthConstrained(), thereby also enabling the expected Matlab-standard format of get(‘PopupWidthConstrained’). However, the property update accessor method is not the expected setPopupWidthConstrained(flag) but rather a non-standard setConstrainPopupWidth(flag). For this reason, it is impossible to set this property using set(‘PopupWidthConstrained’,…), but only via the Java setConstrainPopupWidth() accessor method:

>> set(jCombobox,'PopupWidthConstrained',true)
??? Changing the 'PopupWidthConstrained' property of javahandle_withcallbacks.com.mathworks.hg.peer.ComboboxPeer$MLComboBox is not allowed.
 
>> jCombobox.setPopupWidthConstrained(true)
??? No appropriate method or public field setPopupWidthConstrained for class javahandle_withcallbacks.com.mathworks.hg.peer.ComboboxPeer$MLComboBox.
 
>> jCombobox.setConstrainPopupWidth(true)  % this is ok

For additional customizations of Matlab comboboxes, refer to section 6.7 of my Matlab-Java programming book.

R2014b

We’re all eagerly awaiting the much-anticipated R2014b release. As you all know, this is an important release with major functionality and engine improvements. It is therefore not surprising that the release date (which should normally have been September 1) is somewhat delayed. MathWorkers are hard at work fixing problems in the pre-release beta. This delay was actually anticipated, as can be seen from the pre-release expiry date.

We should all be patient and let MathWorks fix these issues without pressure. This release could be a real home-run and MathWorks should do all it can to ensure that it works as transparently and as backward-compatible as possible so that it indeed becomes a home run rather than an outfield foul ball. Let’s not have a repeat of R2010b, which required two separate service-pack updates. I urge MathWorks to take their time – better safe than sorry. I urge everyone else to be patient – it’s worth the wait.

When 14b is finally out, I will be here with a planned series of articles explaining how we can make good use of all its new goodies. Start drooling…

Happy Jewish New Year everybody!

 
Related posts:
  1. Customizing listbox/combobox items Matlab listboxes can be customized using custom Java cell-renderers. ...
  2. Customizing listbox & editbox scrollbars Matlab listbox and multi-line editbox uicontrols have pre-configured scrollbars. This article shows how they can be customized....
  3. Customizing menu items part 2 Matlab menu items can be customized in a variety of useful ways using their underlying Java object. ...
  4. Customizing menu items part 3 Matlab menu items can easily display custom icons, using just a tiny bit of Java magic powder. ...
 

Transparency in uicontrols

$
0
0

I would like to welcome back guest blogger Robert Cumming, an independent UK contractor who developed a commercial class-based Matlab GUI framework. Today, Robert will highlight how he customized the use of uicontrol CData property.

Before detailing how I used this feature I will start with a basic example. A number of times (see example1, example2), users have asked is it possible to set the background of uicontrols to be transparent?

There are a number of reasons why we might want to do this. For example, we might wish to display a clickable image, and don’t want its background (which is typically white) to be displayed. To place on image on a uicontrol we use its CData property, which according to the official Matlab documentation must be a 3-D array of truecolor RGB values.

Let’s start with a simple example:

uicontrol with white bgcolor

uicontrol with white bgcolor

f = figure;
img = imread('Matlab_Logo.png');
s = size(img);
pb = uicontrol('Style','pushbutton', 'Position',[10 10 s(2) s(1)], 'CData',img, ...
               'Callback',@(a,b)disp('push button'), 'BackgroundColor','green');

The code above produces the figure on the right; when we click on the image, the pushbutton callback is executed.

However the background of the button is white. This is because the image is MxNx3 rectangle the size of the button.

We can set the white portion of the image to be transparent so that it will show the background color of the pushbutton (in our example, ‘green’).

First, we read the image and convert it to a 2D double array that ranges from 0 to 1 (the original image was RGB uint8, 0 to 255). Then find the index for each RGB where the value is 1 (white):

img = imread('Matlab_Logo.png');
img = double(img)/255;
index1 = img(:,:,1) == 1;
index2 = img(:,:,2) == 1;
index3 = img(:,:,3) == 1;
uicontrol with transparent bgcolor

uicontrol with transparent bgcolor

The color (in this example) that we want to make transparent is where all RGB is 1, so calculate a logical index where this is true and update the img variable:

indexWhite = index1+index2+index3==3;
for idx = 1 : 3
   rgb = img(:,:,idx);     % extract part of the image
   rgb(indexWhite) = NaN;  % set the white portion of the image to NaN
   img(:,:,idx) = rgb;     % substitute the update values
end
set(pb, 'CData', img)     % Update the CData variable

Updating the CData we get the image with the green background. We could set the Color of the figure to be green, to match the uicontrol’s background color:

set(f, 'Color', get(pb,'BackgroundColor'))

Transparent background

As mentioned here, we can link the CData to a screenshot image of the parent figure.

When we combine the two methods above, we get the effect of the uicontrol background being transparent (the smaller logo is a button that can be clicked):

uicontrol with transparent background (optical illusion)

uicontrol with transparent background (optical illusion)

f = figure(); % create a figure with an axes on it
ax = axes('Units','pixels', 'Position',[0 0 560 420], 'XTick',[], 'YTick',[], ...
          'Nextplot','add', 'YDir','reverse');
 
% read the big logo image - background of the figure
bigImage = imread('Matlab_LogoBig.png');
image(bigImage, 'parent', ax);  % Display the image in the axes
 
% read a smaller image - background of button
img = imread('Matlab_Logo.png');
s = size(img);
pos = [10 10 s(2) s(1)];  %Position of the button
 
% Extract the portion of the image where the button will be.
F = getframe(ax,pos);  % take a screenshot of the parent figure
pb = uicontrol('Style','pushbutton', 'Units','pixels', 'Position',pos, ...
               'Callback',@(a,b)disp('push button'));
 
% as before - calculate where the button image is white.
img = double(img)/255;
index1 = img(:,:,1) == 1;
index2 = img(:,:,2) == 1;
index3 = img(:,:,3) == 1;
indexWhite = index1+index2+index3==3;
 
% for each pixel, replace the white portion with the parent image data
for idx = 1 : 3
   rgb = 1-img(:,:,idx);                   % To make the picture quirky change the RGB
   pImage = double(F.cdata(:,:,idx))/255;  % extract part of the image
   rgb(indexWhite) = pImage(indexWhite);   % set the white portion of the image to the parent
   img(:,:,idx) = rgb;                     % substitute the update values
end
 
% Update the push button image
set(pb, 'CData', img)

Customizing checkboxes

I have shown how to manipulate the CData of a button. Unfortunately, not all uicontrols have a CData property — the documentation states that pushbuttons and toggle buttons are the only uicontrols that are fully supported. It also mentions that you can use it in radiobuttons and checkboxes, which brings me to how I used it in my application: I use this feature on a checkbox – to use it properly we need to ensure that the size of the image we put in CData is 16x16x3. In this case we set a transparent color by setting pixel RGB values to NaN:

uicontrol with transparent bgcolor

uicontrol with transparent bgcolor

f = figure('Color','red');
smiley = imread('smiley.png');
smiley = double(smiley)/255;
index1 = smiley(:,:,1) == 1;
index2 = smiley(:,:,2) == 1;
index3 = smiley(:,:,3) == 1;
indexWhite = index1+index2+index3==3;
 
% Create a first smiley which has the white background.
uicontrol('Style','checkbox', 'Position',[25 50 16, 16], 'CData',smiley, ...
          'Callback',@(a,b)disp('-1 smiley'));
 
% For each pixel, replace the white portion with the parent image data
for idx = 1 : 3
   rgb = smiley(:,:,idx);  % To make the picture quirky change the RGB
   rgb(indexWhite) = NaN;
   smiley(:,:,idx) = rgb;  % substitute the update values.
end
 
% Create a second smiley which has the transparent background.
uicontrol('Style','checkbox', 'Position',[25 25 16, 16], 'CData',smiley, ...
          'Callback',@(a,b)disp('+1 smiley'), 'BackgroundColor','red');

The upper smiley is the original image; the lower smiley has its white pixels set to NaN, and the background colors of the control and the figure set to equal. The checkbox has no text is displayed, the user just clicks on the smiley to invoke the callback.

Note: This trick works in R2014b but I have deliberately used old style set and get commands for compatibility with older versions of Matlab. I have used this in all versions from R2008a onwards, and I suspect it probably works in older versions as well.

I used this feature several times in my Matlab GUI Toolbox. One of the uses was to create a pin for locking a dynamic panel in position: The panel is by default hidden; when the user hovers the mouse near the edge, the dynamic panel appears after some predefined time (2 seconds). A checkbox with a manipulated CData masquerades as a pin for locking the panel in position. When the panel is pinned, the CData changes accordingly:

transparent uicontrol usage example

Conclusions

1. The CData property of a uicontrol can be set to NaN to imitate transparent behavior.
2. By linking this with the parent CData we can super-impose an image on top of another image.
3. We can customize other uicontrols using the method to turn checkboxes (for example) into clickable images.

Have you used this feature? If so please share in a comment below.

Editor’s note: I have shown another alternative for displaying clickable transparent images in my article on displaying animated/transparent GIFs. Readers might also find interest in the related article on transparent uipanels. Next week I plan to show how MathWorkers Ben Tordoff and David Sampson coerced a simple checkbox uicontrol to have a radically different appearance, as flex-panel dividers in their GUI Layout Toolbox, similarly to what Robert explained today. Stay tuned!  - Yair

 
Related posts:
  1. Images in Matlab uicontrols & labels Images can be added to Matlab controls and labels in a variety of manners, documented and undocumented. ...
  2. Panel-level uicontrols Matlab's uipanel contains a hidden handle to the title label, which can be modified into a checkbox or radio-button control...
  3. Plot line transparency and color gradient Static and interpolated (gradient) colors and transparency can be set for plot lines in HG2. ...
  4. Plot markers transparency and color gradient Matlab plot-line markers can be customized to have transparency and color gradients. ...
 

New book: Accelerating MATLAB Performance

$
0
0

I am pleased to announce that after three years of research and hard work, following my first book on Matlab-Java programming, my new book “Accelerating MATLAB Performance” is finally published.

Accelerating MATLAB Performance book
CRC discount promo code
The Matlab programming environment is often perceived as a platform suitable for prototyping and modeling but not for “serious” applications. One of the main complaints is that Matlab is just too slow.

Accelerating MATLAB Performance (CRC Press, ISBN 9781482211290, 785 pages) aims to correct this perception, by describing multiple ways to greatly improve Matlab program speed.

The book:

  • Demonstrates how to profile MATLAB code for performance and resource usage, enabling users to focus on the program’s actual hotspots
  • Considers tradeoffs in performance tuning, horizontal vs. vertical scalability, latency vs. throughput, and perceived vs. actual performance
  • Explains generic speedup techniques used throughout the software industry and their adaptation for Matlab, plus methods specific to Matlab
  • Analyzes the effects of various data types and processing functions
  • Covers vectorization, parallelization (implicit and explicit), distributed computing, optimization, memory management, chunking, and caching
  • Explains Matlab’s memory model and shows how to profile memory usage and optimize code to reduce memory allocations and data fetches
  • Describes the use of GPU, MEX, FPGA, and other forms of compiled code
  • Details acceleration techniques for GUI, graphics, I/O, Simulink, object-oriented Matlab, Matlab startup, and deployed applications
  • Discusses a wide variety of MathWorks and third-party functions, utilities, libraries, and toolboxes that can help to improve performance

Ideal for novices and professionals alike, the book leaves no stone unturned. It covers all aspects of Matlab, taking a comprehensive approach to boosting Matlab performance. It is packed with thousands of helpful tips, code examples, and online references. Supported by this active website, the book will help readers rapidly attain significant reductions in development costs and program run times.

Additional information about the book, including detailed Table-of-Contents, book structure, reviews, resources and errata list, can be found in a dedicated webpage that I’ve prepared for this book and plan to maintain.

Click here to get your book copy now!
Use promo code MZK07 for a 25% discount and free worldwide shipping on crcpress.com

Instead of focusing on just a single performance aspect, I’ve attempted to cover all bases at least to some degree. The basic idea is that there are numerous different ways to speed up Matlab code: Some users might like vectorization, others may prefer parallelization, still others may choose caching, or smart algorithms, or better memory-management, or compiled C code, or improved I/O, or faster graphics. All of these alternatives are perfectly fine, and the book attempts to cover every major alternative. I hope that you will find some speedup techniques to your liking among the alternatives, and at least a few new insights that you can employ to improve your program’s speed.

I am the first to admit that this book is far from perfect. There are several topics that I would have loved to explore in greater detail, and there are probably many speedup tips that I forgot to mention or have not yet discovered. Still, with over 700 pages of speedup tips, I thought this book might be useful enough as-is, flawed as it may be. After all, it will never be perfect, but I worked very hard to make it close enough, and I really hope that you’ll agree.

If your work relies on Matlab code performance in any way, you might benefit by reading this book. If your organization has several people who might benefit, consider inviting me for dedicated onsite training on Matlab performance and other advanced Matlab topics.

As always, your comments and feedback would be greatly welcome – please post them directly on the book’s webpage.

Happy Holidays everybody!

 
Related posts:
  1. Accelerating MATLAB Performance book Accelerating MATLAB Performance (ISBN 9781482211290) is a book dedicated to improving Matlab performance (speed). ...
  2. Matlab-Java memory leaks, performance Internal fields of Java objects may leak memory - this article explains how to avoid this without sacrificing performance. ...
  3. New book: Undocumented Secrets of MATLAB-Java Programming Undocumented Secrets of Matlab-Java Programming (ISBN 9781439869031) is a book dedicated to the integration of Matlab and Java. ...
  4. MATLAB-Java Programming book Quick links:     Reviews     Table of Contents     Book organization     FAQ     About the author     Errata list For a variety of reasons, the Matlab-Java interface was never...
 

Unorthodox checkbox usage

$
0
0

A few weeks ago, Robert Cumming explained how we can use a Matlab uicontrol’s CData property to provide an optical illusion of a transparent background. Today I will discuss another usage of this property, providing a simple checkbox control the unorthodox appearance of a split-pane divider.

The underlying problem description is easy: we wish to have the ability to split a Matlab uipanel into two or more sub-panels, separated by a draggable horizontal/vertical divider. Such split-panes are standard in any semi-decent GUI, but for some reason were never incorporated in official Matlab. This is a real pity, but not to worry as there are at least two alternatives we could use:

UISplitPane

UISplitPane is a utility that I wrote back in 2009 that uses a Java JSplitPane divider and associates it with plain Matlab panels on both sides. This solves the problem of embedding Matlab axes in Java panels, such as the ones provided by the standard Java JSplitPane. A detailed description of the technique can be found in my dedicated post on this utility.

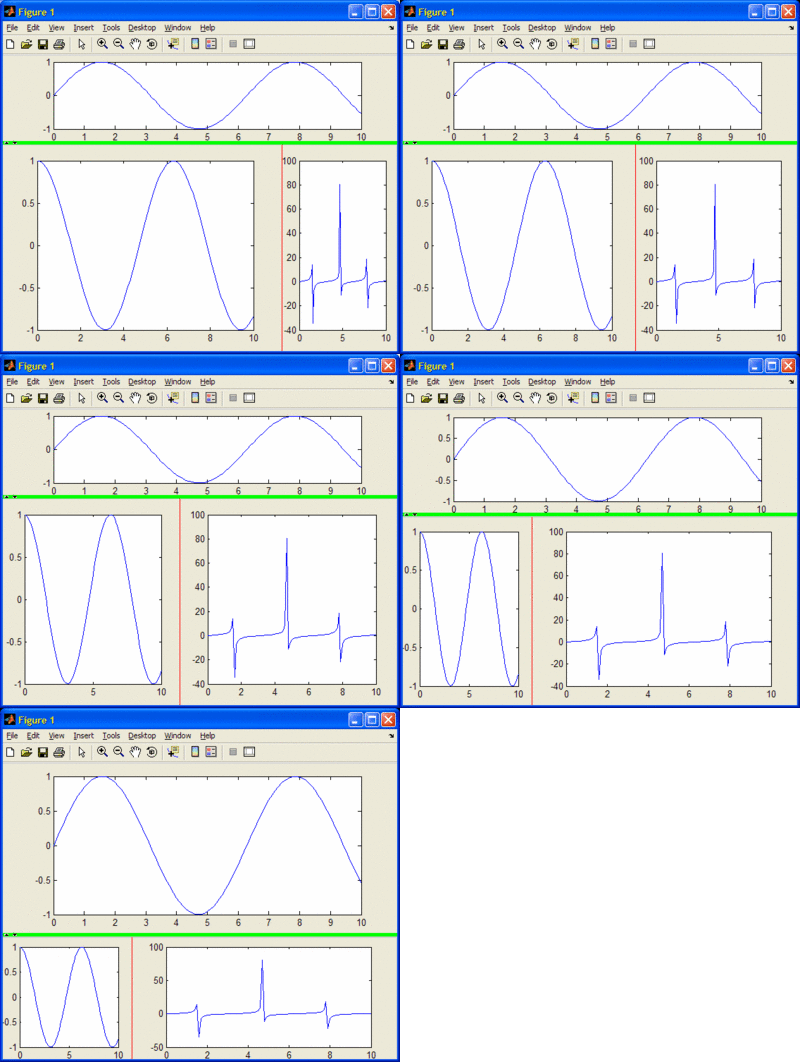
Two levels of UISplitPane, with customized dividers

Two levels of UISplitPane, with customized dividers

[hDown,hUp,hDiv1] = uisplitpane(gcf, 'Orientation','ver', 'dividercolor',[0,1,0]);
[hLeft,hRight,hDiv2] = uisplitpane(hDown, 'dividercolor','r', 'dividerwidth',3);
t=0:.1:10; 
hax1=axes('Parent',hUp);    plot(t,sin(t));
hax2=axes('parent',hLeft);  plot(t,cos(t));
hax3=axes('parent',hRight); plot(t,tan(t));
hDiv1.DividerLocation = 0.75;    % one way to modify divider properties...
set(hDiv2,'DividerColor','red'); % ...and this is another way...

Making UISplitPane work in HG2 (R2014b onward) was quite a pain: numerous changes had to be made. For example, dynamic UDD properties can no longer be added to Matlab handles, only to Java ones. For Matlab handles, we now need to use the addprop function. For such properties, the UDD meta-property SetFunction is now called SetMethod (and similarly for Get) and only accepts function handles (not function handle cells as in UDD). Also, the UDD meta-property AccessFlags.PublicSet='off' needed to change to SetAccess='private'. Also, handle.listener no longer works; instead, we need to use the addlistener function. There are quite a few other similar tweaks, but UISplitPanenow hopefully works well on both old (HG1, R2014a and earlier) and new (HG2, R2014b+) Matlab releases. Let me know if you still see unhandled issues.

UIExtras flex-box

UIExtras (officially named “GUI Layout Toolbox”) is a toolbox of very useful GUI handling functions related to layout management. Written within MathWorks and originally posted in 2010, it has been under continuous maintenance ever since. While being called a “toolbox”, it is in fact freely-downloadable from the Matlab File Exchange.

The new HG2 introduced in R2014b did not just make code porting difficult for me – uiextras’ developers (MathWorkers Ben Tordoff and David Sampson) also encountered great difficulties in porting the code and making sure that it is backward compatible with HG1. In the end they gave up and we now have two distinct versions of the toolbox: the original version for HG1 (R2014a and earlier) and a new version for HG2 (R2014b+).

In my opinion, uiextras is one of the greatest examples of Matlab code on the File Exchange. It is well-written, well-documented and highly performant (although I would also have preferred it to be a bit more robust, it sometimes complains when used). Readers could benefit greatly by studying its techniques, and today’s subject topic is one such example. Specifically, the split-pane divider in uiextras (used by HBoxFlex and VBoxFlex) is simply a Matlab uicontrol having a custom CData property. This CData value is computed and set programmatically (at the bottom of uix.Divider) to display a flat color with some markings at the center (“hand-holds”, a visual cue for interactive dragging, which can be turned off if requested). Thus, for a vertical divider (for an HBoxFlex container) of height 100 pixels and width of 5 pixels, we would get a CData of 100x5x3 (x3 for RGB colors):

hHBox = uiextras.HBoxFlex('Spacing',6, 'BackgroundColor','b');  % Spacing=6 means divider width =6px, and CData width =5px
hLeft  = uicontrol('parent',hHBox, 'style','check', 'string','Left split pane');
hRight = uicontrol('parent',hHBox, 'style','radio', 'string','Right split pane');

UIExtras HBoxFlex with draggable split-pane divider

UIExtras HBoxFlex with draggable split-pane divider

The divider handle is a private property, so we cannot readily access it. However, as I have explained last year, we can use the builtin struct function:

oldWarn = warning('off','MATLAB:structOnObject');  % temporarily disable warning message on discouraged usage
hHBox_data = struct(hHBox);  % this includes hidden/private properties
warning(oldWarn);
hDividers = hHBox_data.Dividers;  % multiple dividers are possible in HBoxFlex/VBoxFlex
cdata = get(hDividers(1), 'CData');

A very nice trick here is that this divider uicontrol is not a pushbutton as we might have expected. Instead, it is a checkbox control. And while it does not look anything like a standard checkbox (due to the custom CData), checkboxes (and radio-buttons) have a very important advantage that caused them to be preferable over buttons: in buttons, there is always a small border showing at the control’s edges, but checkboxes do not have any 3D appearance, or in other words they do not have a border — their CData can span the entire extent of the control. Neat, right?

This enables us to customize the appearance of checkboxes (and radios) to any arbitrary shape, by setting the relevant CData pixels to transparent/bgcolor (as Robert showed last week for buttons). Matlab GUI controls no longer need to look a boring rectangle. We can have clickable stars, draggable icons, and other similar uses. This really opens up the possibilities for rich GUI appearance. If anyone uses this feature, please do post a comment below (preferably with a nice screenshot!).

 
Related posts:
  1. Tri-state checkbox Matlab checkboxes can easily be made to support tri-state functionality....
  2. Profiling Matlab memory usage mtic and mtoc were a couple of undocumented features that enabled users of past Matlab releases to easily profile memory usage. ...
  3. IB-Matlab usage examples Access market/portfolio data and submit trade orders in Matlab via Interactive Brokers (IB). IB-Matlab provides an easy-to-use Matlab interface to InteractiveBrokers, enabling quants, algo traders and ordinary folk to easily...
  4. UISplitPane UISplitPane was recently chosen as Matlab Central's Pick of the Week. Here I detail its use of some undocumented Matlab features....
 

Customizing Matlab uipanels

$
0
0

The major innovation in Matlab release R2014b was the introduction of the new handle-based graphics system (HG2). However, this release also included a few other improvements to graphics/GUI that should not be overlooked. The most notable is that uitabs are finally officially documented/supported, following a decade or being undocumented (well, undocumented in the official sense, since I took the time to document this functionality in this blog and in my Matlab-Java book).

A less-visible improvement occurred with uipanels: Panels are very important containers when designing GUIs. They enable a visual grouping of related controls and introduce order to an otherwise complex GUI. Unfortunately, until R2014b panels were drawn at the canvas level, and did not use a standard Java Swing controls like other uicontrols. This made it impossible to customize uipanels in a similar manner to other GUI uicontrols (example).

In R2014b, uipanels have finally become standard Java Swing controls, a com.mathworks.hg.peer.ui.UIPanelPeer$UIPanelJPanel component that extends Swing’s standard javax.swing.JPanel and Matlab’s ubiquitous com.mathworks.mwswing.MJPanel. This means that we can finally customize it in various ways that are not available in plain Matlab.

We start the discussion with a simple Matlab code snippet. It is deliberately simple, since I wish to demonstrate only the panel aspects:

figure('Menubar','none', 'Color','w');
hPanel = uipanel('Title','Panel title', 'Units','norm', 'Pos',[.1,.1,.6,.7]);
hButton = uicontrol('String','Click!', 'Parent',hPanel);

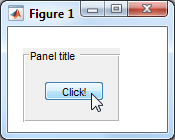
Standard Matlab uipanel

Standard Matlab uipanel

Notice the default ‘etchedin’ panel border, which I hate (note the broken edges at the corners). Luckily, Swing includes a wide range of alternative borders that we can use. I’ve already demonstrated customizing Matlab uicontrols with Java borders back in 2010 (has it really been that long? wow!). In R2014b we can finally do something similar to uipanels:

The first step is to get the uipanel‘s underlying Java component’s reference. We can do this using my findjobj utility, but in the specific case of uipanel we are lucky to have a direct shortcut by using the panel’s undocumented hidden property JavaFrame and its PrintableComponent property:

>> jPanel = hPanel.JavaFrame.getPrintableComponent
jPanel =
com.mathworks.hg.peer.ui.UIPanelPeer$UIPanelJPanel[,0,0,97x74,...]

Let’s now take a look at the jPanel‘s border:

>> jPanel.getBorder
ans =
com.mathworks.hg.peer.ui.borders.TitledBorder@25cd9b97
 
>> jPanel.getBorder.get
                Border: [1x1 com.mathworks.hg.peer.ui.borders.EtchedBorderWithThickness]
          BorderOpaque: 0
                 Class: [1x1 java.lang.Class]
                 Title: 'Panel title'
            TitleColor: [1x1 java.awt.Color]
             TitleFont: [1x1 java.awt.Font]
    TitleJustification: 1
         TitlePosition: 2

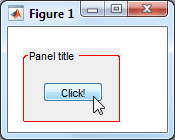
Ok, simple enough. Let’s replace the border’s EtchedBorderWithThickness with something more appealing. We start with a simple red LineBorder having rounded corners and 1px width:

jColor = java.awt.Color.red;  % or: java.awt.Color(1,0,0)
jNewBorder = javax.swing.border.LineBorder(jColor, 1, true);  % red, 1px, rounded=true
jPanel.getBorder.setBorder(jNewBorder);
jPanel.repaint;  % redraw the modified panel

Rounded-corners LineBorder

Rounded-corners LineBorder

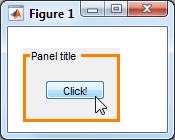
Or maybe a thicker non-rounded orange border:

jColor = java.awt.Color(1,0.5,0);
jNewBorder = javax.swing.border.LineBorder(jColor, 3, false);  % orange, 3px, rounded=false
jPanel.getBorder.setBorder(jNewBorder);
jPanel.repaint;  % redraw the modified panel

Another LineBorder example

Another LineBorder example

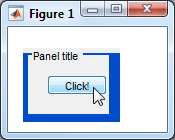
Or maybe a MatteBorder with colored insets:

jColor = java.awt.Color(0,0.3,0.8);  % light-blue
jNewBorder = javax.swing.border.MatteBorder(2,5,8,11,jColor)  % top,left,bottom,right, color
jPanel.getBorder.setBorder(jNewBorder);
jPanel.repaint;  % redraw the modified panel

MatteBorder with solid insets

MatteBorder with solid insets

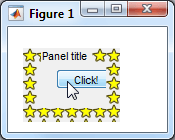
MatteBorder can also use an icon (rather than a solid color) to fill the border insets. First, let’s load the icon. We can either load a file directly from disk, or use one of Matlab’s standard icons. Here are both of these alternatives:

% Alternative #1: load from disk file
icon = javax.swing.ImageIcon('C:\Yair\star.gif');
 
% Alternative #2: load a Matlab resource file
jarFile = fullfile(matlabroot,'/java/jar/mlwidgets.jar');
iconsFolder = '/com/mathworks/mlwidgets/graphics/resources/';
iconURI = ['jar:file:/' jarFile '!' iconsFolder 'favorite_hoverover.png'];  % 14x14 px
icon = javax.swing.ImageIcon(java.net.URL(iconURI));

We can now pass this icon reference to MatteBorder‘s constructor:

w = icon.getIconWidth;
h = icon.getIconHeight;
jNewBorder = javax.swing.border.MatteBorder(h,w,h,w,icon)  % top,left,bottom,right, icon
jPanel.getBorder.setBorder(jNewBorder);
jPanel.repaint;  % redraw the modified panel

MatteBorder with icon insets

MatteBorder with icon insets

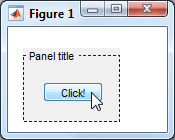
Additional useful Swing borders can be found in the list of classes implementing the Border interface, or via the BorderFactory class. For example, let’s create a dashed border having a 3-2 ratio between the line lengths and the spacing:

jColor = java.awt.Color.blue;  % or: java.awt.Color(0,0,1);
lineWidth = 1;
relativeLineLength = 3;
relativeSpacing = 2;
isRounded = false;
jNewBorder = javax.swing.BorderFactory.createDashedBorder(jColor,lineWidth,relativeLineLength,relativeSpacing,isRounded);
jPanel.getBorder.setBorder(jNewBorder);
jPanel.repaint;  % redraw the modified panel

StrokeBorder (dashed)

StrokeBorder (dashed)

After seeing all these possibilities, I think you’ll agree with me that Matlab’s standard uipanel borders look pale in comparison.

Have you used any interesting borders in your Matlab GUI? Or have you customized your panels in some other nifty manner? If so, then please place a comment below.

 
Related posts:
  1. Transparent uipanels Matlab uipanels can be made transparent, for very useful effects. ...
  2. Customizing Matlab labels Matlab's text uicontrol is not very customizable, and does not support HTML or Tex formatting. This article shows how to display HTML labels in Matlab and some undocumented customizations...
  3. Customizing uicontrol border Matlab uicontrol borders can easily be modified - this article shows how...
  4. Customizing editboxes Matlab's editbox can be customized in many useful manners...
 

Frameless (undecorated) figure windows

$
0
0

All Matlab figures have a standard frame around them, consisting of a border and title bar. In some cases it could be useful to present a figure window, displaying only the contents without the border and title bar. Such a borderless (undecorated) window is not possible in Matlab. Well, at least not in supported/documented Matlab…

Readers of this blog and/or my Matlab-Java programming book are aware that Matlab’s GUI is based on Java Swing. In the end, every Matlab figure window is a simple Java JFrame, and JFrames have a setUndecorated(true) method that can be called to remove the border and title bar.

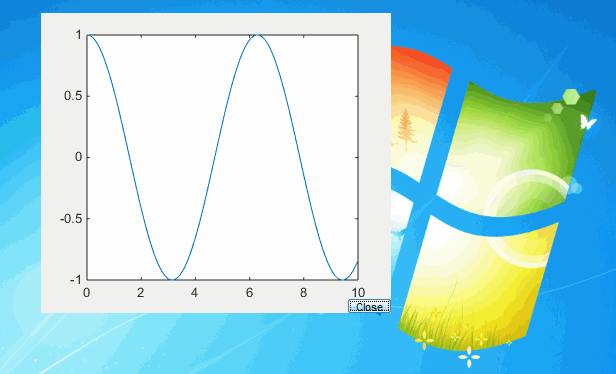
An undecorated Matlab figure window

Attempt #1 – direct invocation

Unfortunately, we cannot directly call setUndecorated in Matlab, because it only works when the JFrame has not yet been displayed:

% Get the figure's underlying Java JFrame reference handle
>> mjf = get(handle(gcf), 'JavaFrame');
>> jWindow = mjf.fHG2Client.getWindow  % or: mjf.getAxisComponent.getTopLevelAncestor
jWindow =
com.mathworks.hg.peer.FigureFrameProxy$FigureFrame[fClientProxyFrame,740,-761,576x509,...]
 
% Try to remove decoration
>> jWindow.setUndecorated(true)
Java exception occurred:
java.awt.IllegalComponentStateException: The frame is displayable.
	at java.awt.Frame.setUndecorated(Unknown Source)

On the other hand, if we try to call setUndecorated on a new invisible figure then we’d see that the JFrame component is not yet created by Matlab:

% Create a simple Matlab figure
hFig = figure('Name','Plot example', 'Visible','off');
 
% Get the underlying Java JFrame reference handle (empty)
>> mjf = get(handle(hFig),'JavaFrame');
>> jWindow = mjf.getAxisComponent.getTopLevelAncestor
jWindow =
     []
>> jWindow = mjf.fHG2Client.getWindow
jWindow =
     []
 
>> jWindow.setUndecorated(true)
Attempt to reference field of non-structure array.

So we have a catch-22 situation: we can’t call setUndecorated until the JFrame is created, but Matlab only creates it when it displays the figure window, and then it’s too late to undecorate…

Attempt #2 – reparenting: an optical illusion

One way that I found around this problem is to reparent the Matlab JFrame‘s content onto a pure Java JFrame that has been made undecorated. To hide the Matlab figure after creating the JFrame, we can simply move the figure’s position to be outside the visible monitor area:

% Create a simple Matlab figure (visible, but outside monitor area)
t = 0 : 0.01 : 10;
hFig = figure('Name','Plot example', 'ToolBar','none', 'MenuBar','none');
hLine = plot(t, cos(t));
hButton = uicontrol('String','Close', 'Position',[307,0,45,16]);
 
% Ensure that everything is rendered, otherwise the following will fail
drawnow;
 
% Get the underlying Java JFrame reference handle
mjf = get(handle(hFig), 'JavaFrame');
jWindow = mjf.fHG2Client.getWindow;  % or: mjf.getAxisComponent.getTopLevelAncestor
 
% Get the content pane's handle
mjc = jWindow.getContentPane;
mjr = jWindow.getRootPane;  % used for the offset below
 
% Create a new pure-Java undecorated JFrame
figTitle = jWindow.getTitle;
jFrame = javaObjectEDT(javax.swing.JFrame(figTitle));
jFrame.setUndecorated(true);
 
% Move the JFrame's on-screen location just on top of the original
jFrame.setLocation(mjc.getLocationOnScreen);
 
% Set the JFrame's size to the Matlab figure's content size
%jFrame.setSize(mjc.getSize);  % slightly incorrect by root-pane's offset
jFrame.setSize(mjc.getWidth+mjr.getX, mjc.getHeight+mjr.getY);
 
% Reparent (move) the contents from the Matlab JFrame to the new JFrame
jFrame.setContentPane(mjc);
 
% Make the new JFrame visible
jFrame.setVisible(true);
 
% Hide the Matlab figure by moving it off-screen
pos = get(hFig,'Position');
set(hFig, 'Position',[-1000,-1000,pos(3:4)]);
drawnow;

Matlab figures are not pure JFrame but rather a subclass (com.mathworks.widgets.desk.DTSingleClientFrame). So instead of creating a new JFrame, we could create a new instance of Matlab’s class instead, potentially solving a few problems:

jDesktop = com.mathworks.mde.desk.MLDesktop.getInstance;
jFrame = javaObjectEDT(com.mathworks.widgets.desk.DTSingleClientFrame(jDesktop, figTitle));
% ...the rest is exactly the same as above...

Either way, we now get a nice undecorated window containing our Matlab contents (see screenshot above).

Once the undecorated JFrame becomes visible, we should not hide or delete the original Matlab figure, because this will stop rendering of the contents.

Working with the undecorated frame

We can modify the Matlab figure and its contents normally, just as if they still appeared within the original Matlab figure. This can be used to display a dynamic application splash-screen, that displays information on various initialization/loading steps. Or alternately we could use it to display a system health-monitor (small panel with red/green indicators), or maybe a graph with streaming market data or live news alerts. The usages are endless, limited only by your imagination, not by Matlab.

For example, let’s modify our plot dynamically using a timer, and set the close button’s callback to dismiss the new JFrame and original figure:

% Set a timer to dynamically update the plot every 0.1 sec
start(timer('TimerFcn', {@timerCallback,hLine}, 'ExecutionMode','fixedRate', 'Period',0.1));
 
% Set the close button callback
set(hButton, 'Callback',{@closeCallback,jFrame});
 
% This is the close button's callback
function closeCallback(hButton, eventData, jFrame)
   delete(ancestor(hButton,'figure'));
   dispose(jFrame);
end
 
% This is the plot timer's callback
function timerCallback(hTimer, eventData, hLine)
   xdata = get(hLine,'XData') + 0.1;
   set(hLine, 'XData',xdata, 'YData',cos(xdata));
   xlim([min(xdata) max(xdata)]);
end

Note: if you don’t hide the toolbar/menubar in the original Matlab figure, some of their functions will not work properly in the new JFrame (e.g., zoom, pan etc.). But in most use-cases we do not want a toolbar/menubar in an undecorated window. The example above showed an undecorated window without the toolbar/menubar.

If we wish to avoid having the new JFrame appear in the Operating System’s taskbar, we can use the following command:

jFrame.setType(javaMethod('valueOf','java.awt.Window$Type','UTILITY'))

Note that this command must be executed before the JFrame is made visible. Also note that it only works with Java 7, in other words Matlab R2013b (8.2) or newer (or if you are very adventurous and happen to use an older Matlab with a custom Java 7 installation).

But now that there is no taskbar component, how can we transfer focus to our new undecorated window? In other words, if another windows hides our new undecorated frame, how can we get it back on top?

A simple solution is to set the Matlab figure frame’s FocusGainedCallback to requestFocus for the newly created jFrame. Then, when we click the Matlab figure’s button on the taskbar, the new jFrame will pop into focus. In effect, this provides the optical illusion that the taskbar button refers to the undecorated window (since the actual Matlab figure is positioned beyond the monitor’s area):

hjWindow = handle(jWindow, 'CallbackProperties');
set(hjWindow, 'FocusGainedCallback', @(h,e)jFrame.requestFocus);

Likewise, we should instrument our Matlab figure so that when it is closed/deleted, so too is our new jFrame:

set(hjWindow, 'WindowClosedCallback', @(h,e)jFrame_.dispose);

undecorateFig and redecorateFig

I have encapsulated all of the above in a couple of very easy-to-use utilities that I just posted on the Matlab File Exchange: undecorateFig, redecorateFig. Using them can’t get any simpler than this:

undecorateFig;        % undecorate the current figure (gcf)
undecorateFig(hFig);  % hFig is any GUI handle (needs to be visible)
 
redecorateFig;        % redecorate the current figure (gcf)
redecorateFig(hFig);  % hFig is any GUI handle

Any sufficiently advanced technology is indistinguishable from magic – Arthur C. Clarke   :-)

Have you made some interesting use of this nice feature in your application? If so, please share it in a comment below.

A suggested related mini project for anyone interested: add an image reflection of the current figure contents beneath the figure. You could use my ScreenCapture utility or directly use java.awt.Robot.createScreenCapture(mjc.getLocationOnScreen), process the resulting image (blur, apply transparency gradient, crop at 50% height etc.) and place the resulting image within an undecorated JFrame placed directly beneath the main figure. You can instrument the figure (hjWindow)’s ComponentMovedCallback and ComponentResizedCallback to move/resize the reflection JFrame whenever the parent figure moves or is resized. You could use a timer to periodically update the reflection image so that it remains synchronized with the parent. You’ll probably also want to add a nice toggle-button to the figure’s toolbar to turn the reflection on/off. Maybe I’ll hack this project someday when I have some spare time. Or maybe someone will beat me to it… Care to try?

 
Related posts:
  1. Minimize/maximize figure window Matlab figure windows can easily be maximized, minimized and restored using a bit of undocumented magic powder...
  2. Transparent Matlab figure window Matlab figure windows can be made fully or partially transparent/translucent or blurred - this article explains how...
  3. Blurred Matlab figure window Matlab figure windows can be blurred using a semi-transparent overlaid window - this article explains how...
  4. Customizing figure toolbar background Setting the figure toolbar's background color can easily be done using just a tiny bit of Java magic powder. This article explains how. ...
 

Auto-completion widget

$
0
0

Do you ever get a feeling when designing a Matlab GUI, that existing components/controls are simply not enough to achieve the desired functionality/appearance?

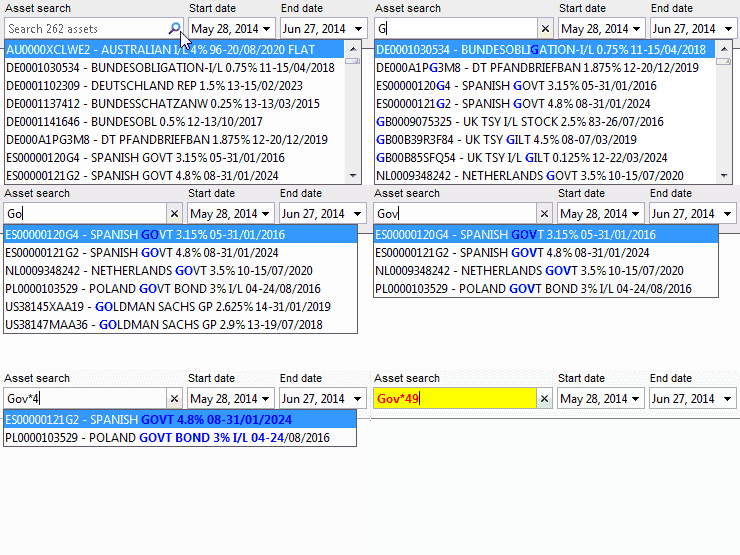
Such a case happened to me, when a consulting client asked me to integrate an auto-completion widget in a GUI that I designed for them. The idea was simple enough: the user selects a class of financial assets from a drop-down, then one or more actual financial securities from a dynamically-populated drop-down (based on the asset class), then the date range and analysis function, and finally the results are plotted in the main panel. The idea was for Matlab to automatically auto-complete the financial instruments matching the entered text, as it is being typed, similarly to other standard auto-completion widgets (e.g., Google’s search box), including the use of wildcards and regular expressions:

Interactive Matlab auto-completion widget

Interactive Matlab auto-completion widget

Note that in this particular case, I use the term “auto-completion” loosely. The correct term should actually be “auto-winnowing” or “auto-filtering”. Auto-completion is usually reserved for the case of the user-entered text being automatically completed as they type, whereas auto-winnowing only updates the drop-down options on-the-fly. These two functionalities are often correlated, and today’s article will discuss both.

AutoCompletionList

Before I dive into details of the implementation I ended up with, note that there are simpler alternatives. For example, we can use Matlab’s internal com.mathworks.widgets.AutoCompletionList widget:

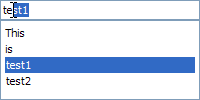
strs = {'This','is','test1','test2'};
strList = java.util.ArrayList;
for idx = 1 : length(strs),  strList.add(strs{idx});  end
jPanelObj = com.mathworks.widgets.AutoCompletionList(strList,'');
javacomponent(jPanelObj.getComponent, [10,10,200,100], gcf);

AutoCompletionList widget

AutoCompletionList widget

The AutoCompletionList control is actually a list (rather than a drop-down), where the user types an entry in the header row. The control automatically selects the first corresponding list item and auto-completes the rest of the entry. Invalid user entries generate a beep and are not allowed by default (unless the widget’s Strict property is cleared: jPanelObj.setStrict(false)). The visible list size can be controlled by setting the widget’s VisibleRowCount property (jPanelObj.setVisibleRowCount(6)).

Items can be selected by either typing in the header row, by selecting a list item, or programmatically (jPanelObj.setSelectedValue('test1')). The currently selected item is retrieved via the same SelectedValue property (selectedValue = char(jPanelObj.getSelectedValue)). As with many other actionable Java controls, we can attach a callback on the ActionPerformed event:

set(handle(jPanelObj,'callbackproperties'), 'ActionPerformedCallback', @myMatlabCallbackFunc);

We can attach a similar callback to key-typing within the header row (text field), by accessing the widget’s internal component (which is the one that is actually being displayed via the javacomponent function):

set(handle(jPanelObj.getComponent,'callbackproperties'), 'KeyTypedCallback', @myMatlabCallbackFunc);

SearchTextField

For my client’s purposes, however, AutoCompletionList could not be used. We wanted a drop-down selector that takes up far less space than a listbox. The first thought was to use a modified drop-down (editable combo-box). This turned out to be less effective than hoped, because of the interference between the Matlab KeyTypedCallback function and the automatic behavior of the combo-box. I do not rule out the use of such an editable combo-box in other use-cases, but for this implementation I chose to use a different control, namely Matlab’s internal com.mathworks.widgets.SearchTextField, which has some nice additional features such as an optional light-gray prompt, and a clickable search icon that changes its appearance and behavior based on the entered text:

jPanelObj = com.mathworks.widgets.SearchTextField('Enter search term:');
[jhPanel,hContainer] = javacomponent(jPanelObj.getComponent, [10,10,150,25], gcf);
SearchTextField initial view

SearchTextField initial view

user clicks in entry box (prompt text disappears)

user clicks in entry box (prompt text disappears)

user types something (icon changes, clicking it will clear the text)

user types something
(icon changes, clicking it will clear the text)

An optical illusion

As with a regular combo-box, the dropdown-menu integration in Matlab proved a bit difficult, especially due to the auto-completion feature. Again, I do not rule out using it in other use-cases, but for this implementation I chose to use a visual illusion: an actual combo-box is placed beneath (hidden by) the SearchTextField control. So basically, we are seeing two disparate parts of two separate components: the edit-box of the SearchTextField and the dropdown panel (a JPopupMenu) of the hidden combo-box. They appear attached, providing the optical illusion of being a single widget, when in fact they are not. Neat, right?

Callback events are used to synchronize the components, update the combo-box’s dropdown options and display the dropdown panel. We attach the same callback function to 3 separate events: MouseClickedCallback on the search button (icon), KeyPressedCallback on the search text-box, and another KeyPressedCallback on the combo-box’s text-box (which is not visible, but automatically receives focus when the user interacts with the popup menu (drop-down panel):

% Create the SearchTextField component (after the hidden combo was created)
jAssetChooser = com.mathworks.widgets.SearchTextField('Enter search:');
jAssetComponent = jAssetChooser.getComponent;
[jhAssetComponent, hContainer] = javacomponent(jAssetComponent,[],hPanel);
 
% Set callbacks
hjSearchButton = handle(jAssetComponent.getComponent(1), 'CallbackProperties');
set(hjSearchButton, 'MouseClickedCallback', {@updateSearch,jCombo,jAssetChooser});
 
hjSearchField = handle(jAssetComponent.getComponent(0), 'CallbackProperties');
set(hjSearchField, 'KeyPressedCallback', {@updateSearch,jCombo,jAssetChooser});
 
jComboField = handle(jCombo.getComponent(2), 'CallbackProperties');
set(jComboField, 'KeyPressedCallback', {@updateSearch,jCombo,[]});

The user can now select an item either from the combo-box’s dropdown panel, or by typing in the search text-box. Here is the implementation of the updateSearch() callback function:

% Asset search popup combo button click callback
function updateSearch(hObject, eventData, jCombo, jAssetChooser) %#ok<INUSL>
    persistent lastSearchText
    if isempty(lastSearchText),  lastSearchText = '';  end
 
    try
        % event occurred on the search field component
        try
            searchText = jAssetChooser.getSearchText;
            jSearchTextField = jAssetChooser.getComponent.getComponent(0);
        catch
            % Came via asset change - always update
            jSearchTextField = jAssetChooser.getComponent(0);
            searchText = jSearchTextField.getText;
            lastSearchText = '!@#$';
        end
    catch
        try
            % event occurred on the jCombo-box itself
            searchText = jCombo.getSelectedItem;
        catch
            % event occurred on the internal edit-field sub-component
            searchText = jCombo.getText;
            jCombo = jCombo.getParent;
        end
        jSearchTextField = jCombo.getComponent(jCombo.getComponentCount-1);
    end
    searchText = strrep(char(searchText), '*', '.*');  % turn into a valid regexp
    searchText = regexprep(searchText, '<[^>]+>', '');
    if strcmpi(searchText, lastSearchText) && ~isempty(searchText)
        jCombo.showPopup;
        return;  % maybe just clicked an arrow key or Home/End - no need to refresh the popup panel
    end
    lastSearchText = searchText;
 
    assetClassIdx = getappdata(handles.cbAssetClass, 'assetClassIdx');
    if isempty(assetClassIdx)
        jCombo.hidePopup;
        return;
    elseif isempty(searchText)
        assetNamesIdx = assetClassIdx;
    else
        searchComponents = strsplit(searchText, ' - ');
        assetCodeIdx = ~cellfun('isempty',regexpi(data.header.AssetCode(assetClassIdx),searchComponents{1}));
        assetNameIdx = ~cellfun('isempty',regexpi(data.header.AssetName(assetClassIdx),searchComponents{end}));
        if numel(searchComponents) > 1
            assetNamesIdx = assetClassIdx(assetCodeIdx & assetNameIdx);
        else
            assetNamesIdx = assetClassIdx(assetCodeIdx | assetNameIdx);
        end
    end
    setappdata(handles.cbAssetSearch, 'assetNameIdx', assetNamesIdx);
    if isempty(assetNamesIdx)
        jCombo.hidePopup;
        jSearchTextField.setBackground(java.awt.Color.yellow);
        jSearchTextField.setForeground(java.awt.Color.red);
        newFont = jSearchTextField.getFont.deriveFont(uint8(java.awt.Font.BOLD));
        jSearchTextField.setFont(newFont);
        return;
    else
        jSearchTextField.setBackground(java.awt.Color.white);
        jSearchTextField.setForeground(java.awt.Color.black);
        newFont = jSearchTextField.getFont.deriveFont(uint8(java.awt.Font.PLAIN));
        jSearchTextField.setFont(newFont);
    end
 
    % Compute the filtered asset names (highlight the selected search term)
    assetNames = strcat(data.header.AssetCode(assetNamesIdx), ' -=', data.header.AssetName(assetNamesIdx));
    assetNames = regexprep(assetNames, '(.+) -=\1', '$1', 'ignorecase');
    assetNames = unique(strrep(assetNames, ' -=', ' - '));
    if ~isempty(searchText)
        assetNames = regexprep(assetNames, ['(' searchText ')'], '<b><font color=blue>$1</font></b>', 'ignorecase');
        assetNames = strcat('<html>', assetNames);
    end
 
    % Redisplay the updated combo-box popup panel
    jCombo.setModel(javax.swing.DefaultComboBoxModel(assetNames));
    jCombo.showPopup;
end  % updateSearch

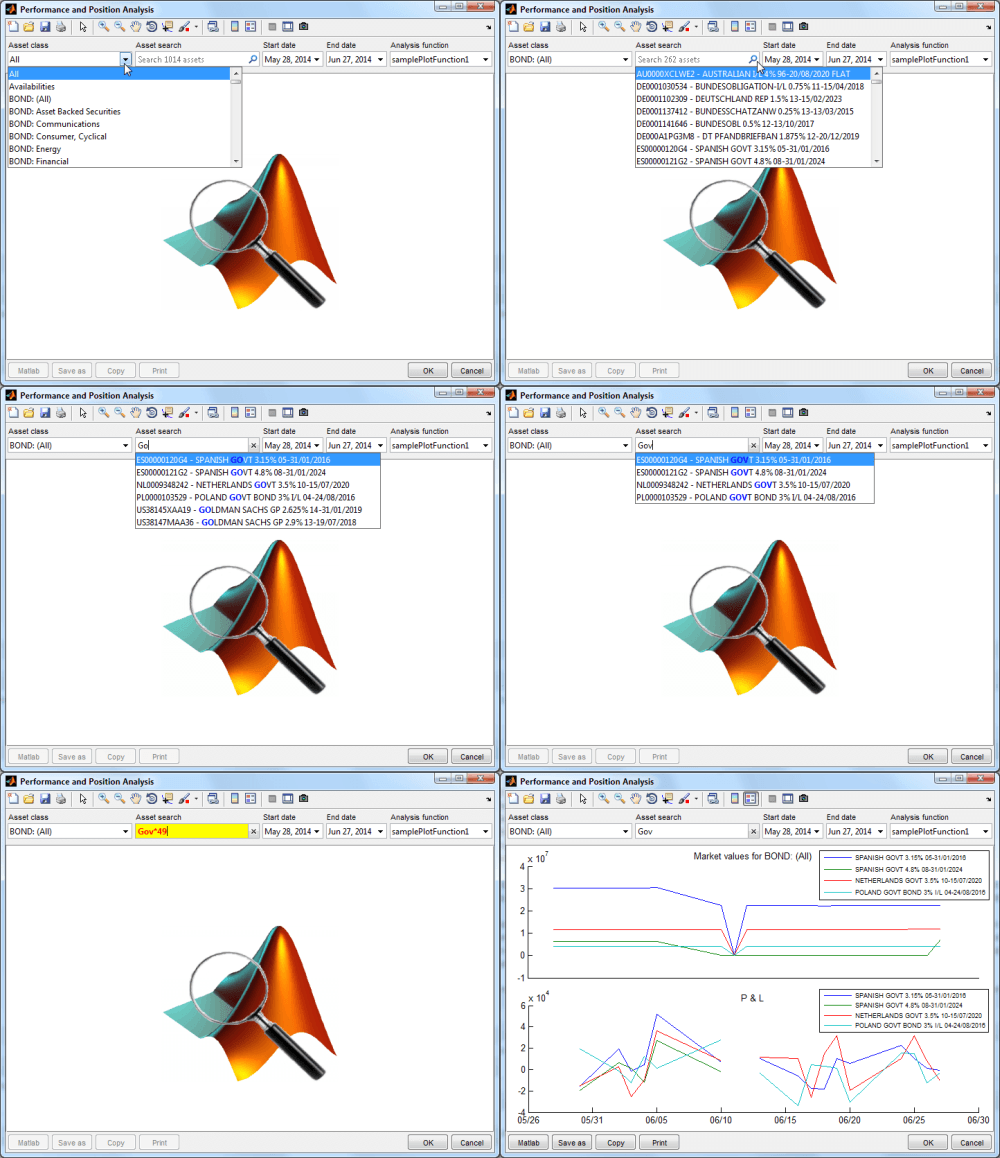
Here is the final result:

Matlab GUI with integrated auto-completion & date selection widgets

Matlab GUI with integrated auto-completion & date selection widgets


Would you believe that this entire program is only 400 lines of code?!

Conclusion

I’ve heard it say on occasion that Matlab GUI is not really suited for professional applications. I completely disagree, and hope that today’s article proves otherwise. You can make Matlab GUI do wonders, in various different ways. Matlab does have limitations, but they are nowhere close to what many people believe. If you complain that your GUI sucks, then it is likely not because of Matlab’s lack of abilities, but because you are only using a very limited portion of them. This is no different than any other programming environment (admittedly, such features are much better documented in other environments).

In short, to improve your GUI’s functionality and appearance, you just need to spend a bit of time searching for the right components (possibly using my book), or hire a professional consultant to do it for you. But of course, just bitching about Matlab’s supposed limitations is much easier…

Do you have a GUI that you find hard to believe can be done (or improved) in Matlab? Contact me for a consulting proposal and let me surprise you!

 
Related posts:
  1. Class object tab completion & improper field names Tab completions and property access can be customized for user-created Matlab classes. ...
  2. Plot-type selection components Several built-in components enable programmatic plot-type selection in Matlab GUI - this article explains how...
  3. Animated busy (spinning) icon An animated spinning icon label can easily be embedded in Matlab GUI. ...
  4. FindJObj GUI – display container hierarchy The FindJObj utility can be used to present a GUI that displays a Matlab container's internal Java components, properties and callbacks....
 

copyobj behavior change in HG2

$
0
0

As a followup to last-week’s post on class-object and generic data copies, I would like to welcome back guest blogger Robert Cumming, who developed a commercial Matlab GUI framework. Today, Robert will highlight a behavior change of Matlab’s copyobj function in HG2.

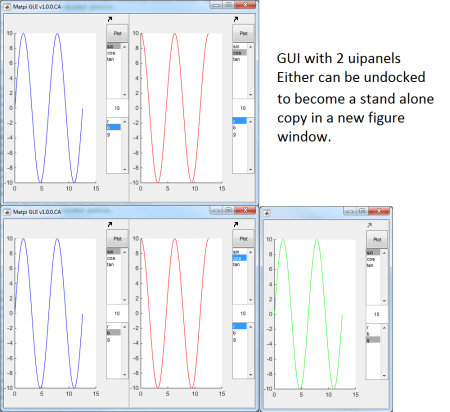
One of the latest features that was introduced to the GUI Toolbox was the ability to undock or copy panels, that would be displayed in a standalone figure window, but remain connected to the underlying class object:

Panel copy in the GUI framework toolbox

Panel copy in the GUI framework toolbox

These panel copies had to remain fully functional, including all children and callbacks, and they needed to retain all connections back to the source data. In the example above I have altered the plot to show that it’s an actual copy of the data, but has separate behavior from the original panel.

To simply undock a uipanel to a new figure, we can simply re parent it by updating its Parent property to the new figure handle. To make a copy we need to utilize the copyobj function, rather than re-parenting. copyobj can be used to make a copy of all graphic objects that are “grouped” under a common parent, placing their copy in a new parent. In HG2 (R2014b onwards) the default operation of copyobj has changed.

When I started developing this feature everything looked okay and all the objects appeared copied. However, none of the callbacks were functional and all the information stored in the object’s ApplicationData was missing.

I had used copyobj in the past, so I knew that it originally worked ok, so I investigated what was happening. Matlab’s documentation for HG2 code transition suggests re-running the original code to create the second object to populate the callbacks. Unfortunately, this may not be suitable in all cases. Certainly in this case it would be much harder to do, than if the original callbacks had been copied directly. Another suggestion is to use the new ‘lagacy’ option’:

copyobj(___,’legacy’) copies object callback properties and object application data. This behavior is consistent with versions of copyobj before MATLAB® release R2014b.

So, instead of re-running the original code to create the second object to populate the callbacks, we can simply use the new ‘legacy’ option to copy all the callbacks and ApplicationData:

copyobj(hPanel, hNewParent, 'legacy')

Note: for some reason, this new ‘legacy’ option is mentioned in both the doc page and the above-mentioned HG2 code-transition page, but not in the often used help section (help copyobj). There is also no link to the relevant HG2 code-transition page in either the help section or the doc page. I find it unfortunate that for such a backward-incompatible behavior change, MathWorks has not seen fit to document the information more prominently.

Other things to note (this is probably not an exhaustive list…) when you are using copyobj:

  • Any event listeners won’t be copied
  • Any uicontextmenus will not be copied – it will in fact behave strangely due to the fact that it will have the uicontextmenu – but the parent is the original figure – and when you right-click on the object it will change the figure focus. For example:
    hFig= figure;
    ax = axes;
    uic = uicontextmenu ('parent', hFig);
    uim = uimenu('label','My Label', 'parent',uic);
    ax.UIContextMenu = uic;
     
    copyChildren = copyobj (ax, hFig, 'legacy');
     
    hFig2 = figure;
    copyChildren.Parent = hFig2;

Another note on undocked copies – you will need to manage your callbacks appropriately so that the callbacks manage whether they are being run by the original figure or in a new undocked figure.

Conclusions

  1. copyobj has changed in HG2 – but the “legacy” switch allows you to use it as before.
  2. It is unfortunate that backward compatibility was not fully preserved (nor documented enough) in HG2, but at least we have an escape hatch in this case.
  3. Take care with the legacy option as you may need to alter uicontextmenus and re-attach listeners as required.

 
Related posts:
  1. Property value change listeners HG handle property changes can be trapped in a user-defined callback. ...
  2. Handle Graphics Behavior HG behaviors are an important aspect of Matlab graphics that enable custom control of handle functionality. ...
  3. Undocumented scatter plot behavior The scatter plot function has an undocumented behavior when plotting more than 100 points: it returns a single unified patch object handle, rather than a patch handle for each specific...
  4. xlsread functionality change in R2012a The functionality of the xlsread function has changed without documentation or warning in the R2012a release. ...
 

Sliders in Matlab GUI

$
0
0

One of my consulting clients asked me last week if I knew an easy way to integrate a range (dual-knob) slider control in Matlab GUI. Today’s post is an expansion of the answer I provided him, which I though might interest other Matlab users.

Matlab vs. Java sliders

As funny as it may sound, Matlab’s so-called “slider” control (uicontrol('Style','slider')) is actually implemented as a scroll-bar, rather than the more natural JSlider. I believe that this is due to a design decision that occurred sometime in the 1990′s (sliders were not as prevalent then as they are nowadays). This was never corrected, probably for backward-compatibility reasons. So to this day, Matlab’s so-called “slider” is actually a scroll-bar, and we do not [yet] have a real slider control in standard Matlab, apparently since the ‘slider’ uicontrol style is already in use. Spoiler alert: this will change soon — keep reading.

It gets worse: for some reason Matlab’s implementation of the so-called “slider” uses a Windows95 look-and-feel that makes the control look antique in today’s GUI standards. Using Java Swing’s standard JScrollBar control would at least have made it appear more consistent with the other Matlab controls, which are all based more closely on Java Swing:

Matlab "slider" uicontrol (bottom), Java JScrollBar (above), and JSlider (top 2)

Matlab "slider" uicontrol (bottom),
Java JScrollBar (above),
and JSlider (top 2)

% Standard Matlab "slider"
uicontrol('style','slider', 'position',[10,10,200,20]);
 
% Standard Java JScrollBar
jScrollbar = javax.swing.JScrollBar;
jScrollbar.setOrientation(jScrollbar.HORIZONTAL);
javacomponent(jScrollbar,[10,40,200,20]);
 
% Standard Java JSlider (20px high if no ticks/labels, otherwise use 45px)
jSlider = javax.swing.JSlider;
javacomponent(jSlider,[10,70,200,45]);

I advise users of the current Matlab GUI to use JScrollBar or JSlider, rather than Matlab’s standard “slider” uicontrol. The rest of today’s post will discuss the JSlider variant.

Using JSlider

As shown above, we can use the javacomponent function to display any Java component in a Matlab container (such as uipanel or figure). We can easily modify the slider’s appearance using its internal properties:

set(jSlider, 'Value',84, 'MajorTickSpacing',20, 'PaintLabels',true);  % with labels, no ticks

JSlider customization
set(jSlider, 'Value',22, 'PaintLabels',false, 'PaintTicks',true);  % with ticks, no labels

JSlider customization
jSlider.setPaintLabels(true);  % or: jSlider.setPaintLabels(1);  % with both ticks and labels

JSlider customization
[jhSlider, hContainer] = javacomponent(jSlider,[10,10,100,40]);
set(jSlider, 'Value',72, 'Orientation',jSlider.VERTICAL, 'MinorTickSpacing',5);
set(hContainer,'position',[10,10,40,100]); %note container size change

JSlider customization

We can query the current slider value via its Value property:

>> value = get(jSlider,'Value');  % or: value = jSlider.getValue;
value =
    29

We can easily attach Matlab callback functions to slider value-change events:

>> hjSlider = handle(jSlider, 'CallbackProperties')
hjSlider =
	javahandle_withcallbacks.javax.swing.JSlider
 
>> hjSlider.StateChangedCallback = @(hjSlider,eventData) disp(get(hjSlider,'Value'));
>> set(hjSlider, 'StateChangedCallback', @myCallback);  %alternative

As you can see, standard Java controls (such as JSlider here) are very simple to customize and use in Matlab GUI. I have shown more complex customizations elsewhere in this blog, as well as in my Matlab-Java programming book.

Range (dual-knob) sliders

This brings me to my client’s query that I mentioned at the beginning of this post: JSlider only contains a single knob. Is it possible to integrate a range (dual-knob) slider?

My initial response was to simply google for “Java range slider“. This returns numerous different controls, both open-source and commercial, that we can download and integrate in Matlab. All it takes is to download the *.class, *.zip or *.jar file that contains the component, add it to Matlab Java classpath using the javaaddpath function, and then use the javacomponent to display it, just as we did with JSlider above.

This is simple enough, but then I thought of an even simpler solution, namely to use JIDE’s library of commercial-grade controls that is pre-bundled in Matlab. Surely enough, a quick search in JIDE’s enormous catalog yielded its RangeSlider component, which extends JSlider with a dual knob. RangeSlider‘s appearance has changed somewhat across Matlab releases (or actually, JIDE releases, as they are integrated within the corresponding Matlab releases), but its basic functionality remained unchanged:

jRangeSlider = com.jidesoft.swing.RangeSlider(0,100,20,70);  % min,max,low,high
jRangeSlider = javacomponent(jRangeSlider, [0,0,200,80], gcf);
set(jRangeSlider, 'MajorTickSpacing',25, 'MinorTickSpacing',5, 'PaintTicks',true, 'PaintLabels',true, ...
    'Background',java.awt.Color.white, 'StateChangedCallback',@myCallbackFunc);

RangeSlider in R2010b   RangeSlider in R2014b

RangeSlider in R2010b (left), R2014b (right)

We can move the two knobs relative to each other. We can also move the entire range (i.e., both knobs at once), by either dragging the square on top of the right knob (R2010b), or by dragging the space between the two knobs (R2014b).

The benefit of JIDE controls is that they are pre-bundled in every Matlab installation and deployed MCR. There is no need to download anything, nor to use javaaddpath. All the richness of JIDE’s commercial-grade libraries (at least those libraries used in Matlab, which is plenty) is automatically available to us within Matlab, just as easily as the standard Java Swing controls. MathWorks has already paid a small fortune to integrate JIDE’s libraries in Matlab, and we can use it free of charge within Matlab GUIs. This is a great (and sadly undocumented) advantage of Matlab GUI. Matlab GUI programmers who wish to enrich their GUI are strongly encourages to take the time to review the long list of controls provide by JIDE in Matlab. I’ve posted quite a few articles on using JIDE components in Matlab – feel free to take a look and see the richness that JIDE can bring to your GUI. Additional material can be found in my Matlab-Java programming book.

In the specific case of RangeSlider, this control is part of the JIDE Common Layer that JideSoft open-sourced a few years ago. This means that we can download the latest version of this library and use it in Matlab, in case it has some new component that is still not available in our version of Matlab. For example, Matlab R2014b includes JIDE version 3.4.1, released by JideSoft on May 2012 – the latest version (3.6.9, released last week) includes numerous fixes and improvements that were integrated in the past 3 years:

>> com.jidesoft.utils.Lm.getProductVersion
ans =
3.4.1

Note that JIDE’s online documentation (PDF, javadoc, webpage) always refers to the latest version. To use the latest Common-layer library in Matlab, simply download it and replace Matlab’s pre-bundled <matlabroot>/java/jarext/jide/jide-common.jar file. Be careful with changing Matlab’s installation files (such as this one), as there is always a risk that some Matlab functionality might break. So always keep a copy of the original file, in case you need to revert your changes. Alternatively, place the jide-common.jar file in some other user folder and use it in Matlab on an as-needed basis using javaaddpath and javarmpath.

Using the latest commercial (non-open-sourced) JIDE libraries, such as jide-grids.jar, jide-components.jar or jide-charts.jar, is only possible if you purchase them from JideSoft. But as noted, we can freely use the older bundled libraries in our Matlab GUIs without paying JideSoft anything.

Disclaimer: I am an engineer, not a lawyer. What I said above is my personal opinion; it is not legal advice. If you are unsure about licensing of JIDE components in your programs, contact MathWorks or JideSoft.

AppDesigner – Matlab’s new GUI

Last autumn, with little fanfare, MathWorks released the App Designer toolbox, which can be freely downloaded from the File Exchange. This is not just another File Exchange utility. It is in fact an official MathWorks Technical Preview that is both functional by itself, and also provides very interesting insight of Matlab’s upcoming new GUI. MathWorks have not announced exactly when this new AppDesigner will replace the aging GUIDE in Matlab. But the fact that AppDesigner is an actual working product in the public domain since late 2014, and that MathWorks has officially endorsed it as a “Technical Preview”, mean that this day is close.

In the new AppDesigner, sliders finally appear modern, complete with all sorts of customizable properties:

Sliders in Matlab's new AppDesigner

Sliders in Matlab's new AppDesigner

Java controls still provide more customizability than Matlab, even in the new AppDesigner, but the functionality gap is now significantly reduced. This provides the flexibility of modern easy-to-create/maintain GUIs for users who do not need to preserve backward-compatibility with existing GUIs or extra customizabilty enabled by Java, while preserving the functionality for those who do.

Java components and even standard Matlab uicontrols cannot be added to an AppDesigner window because it is not a standard Java JFrame window. The new App window has its own set of controls, separate from uicontrols (topic for a separate blog post someday). However, we can always keep using javacomponent and uicontrol in plain-ol’ figures, as before, side-by-side with the new AppDesigned windows. The new App window can be created using the new appwindow function, whereas the existing figure function creates a standard figure window (basically a Java JFrame) that accepts javacomponent and uicontrol. Maybe one day I’ll find out if there’s a way to combine these two seemingly disparate sets of GUIs. In the meantime I’m content that there’s a new way to create Matlab GUIs that has not previously existed.

AppDesigner is a very nice addition for Matlab GUI builders, and it will get even better with time. Having looked at some of the internals, I’m drooling over the potential improvements. MathWorks has invested quite a bit in this new product, so I’m confident that many of these improvements will find their way into AppDesigner in the upcoming releases. I just hope it will remain a free utility and will not turn into an addon toolbox when officially released (I have not seen any mention about this either way, so it’s still an open question; I’ll clarify this point here when I learn something). For the time being, AppDesigner is free to use.

MathWorks is actively looking for ways to improve AppDesigner, so if you find any functionality that is missing or buggy, please provide feedback:

Feedback for Matlab's new AppDesigner

Feedback for Matlab's new AppDesigner

Conclusions and some personal musings

Matlab itself has kept its Desktop GUI relatively modern, and integrates advanced JIDE GUI controls internally. But until AppDesigner came about, Matlab application builders were not provided with similarly modern documented GUI components and design tools, in keeping with the times.

It is indeed possible, as I’ve repeatedly claimed in this blog, to create professional-looking GUIs in Matlab. However, this currently requires using undocumented features and Java controls.

In Matlab’s upcoming AppDesigner, making professional-looking Matlab GUIs will be easier, with sleek new controls, user-friendly visual layout, and easy-to-maintain class-based code. I still find the tech-preview to be lacking in some respects, and not integrated with the existing GUI functionality. Still, the fact that MathWorks has gone out of its way to provide a Technical Preview of its upcoming new GUI, despite its normal reluctance to provide a technical development roadmap, shows a commitment to improving Matlab’s user-facing front-end. This makes me optimistic that most shortcomings will be solved by the time AppDesigner is officially released, hopefully soon.

Until this happens, and possibly even later, we can significantly improve Matlab’s standard GUI using Java in standard figure windows. Interested readers can find out more information about integrating Java controls in Matlab GUI in my book “Undocumented Secrets of MATLAB-Java Programming” (CRC Press, 2011, ISBN 978-1439869031). If you already have this book, please be kind enough to post your feedback on it on Amazon (link), for the benefit of others.

 
Related posts:
  1. Using pure Java GUI in deployed Matlab apps Using pure-Java GUI in deployed Matlab apps requires a special yet simple adaptation. ...
  2. Matlab and the Event Dispatch Thread (EDT) The Java Swing Event Dispatch Thread (EDT) is very important for Matlab GUI timings. This article explains the potential pitfalls and their avoidance using undocumented Matlab functionality....
  3. Blurred Matlab figure window Matlab figure windows can be blurred using a semi-transparent overlaid window - this article explains how...
  4. FindJObj – find a Matlab component’s underlying Java object The FindJObj utility can be used to access and display the internal components of Matlab controls and containers. This article explains its uses and inner mechanism....
 

Some performance-tuning tips

$
0
0

Today’s post is about performance. My goal is to show that contrary to widespread perception, Matlab is not inherently too slow to be used for real-life programs. In fact, by taking a small amount of time (compared to the overall dev time), Matlab programs can be accelerated by a large factor. I wish to demonstrate this claim with work that I recently completed for the Crustal Dynamics research group at Harvard University. They have created interactive Matlab GUIs for earthquake hazard, visualizing deformation and motion at plate boundary zones, recorded as GPS velocities:

Crustal dynamics visualization GUI

Crustal dynamics visualization GUI

These GUIs served them well for several years. But when they recently tried to analyze larger problems that involved far more data, it was getting so slow that it limited their ability to interrogate the GUI results effectively and do productive science (take a look at all the data points around New Zealand in the screenshot above). This is when I stepped in to help.

Two main performance issues stood out above the rest: Loading the data, and displaying the textual labels of numeric slip rates.

I/O: Loading data

I began with optimizing the data load time. This involves loading several different data files, which have custom textual formats. Of course, had the data files been initially created in some binary format, we could load it much faster. But we were faced with an existing situation where the textual data format was a given fact. Using Matlab’s profiler, it quickly emerged, as expected, that most of the time was spent parsing the text files. Two specific types of parsing were used, and they were both quite slow: reading the input files using textread, and parsing the input data using str2num.

To read the data from the files, I replaced the textread calls with corresponding textscan ones:

% Old (slow) code:
[Station.lon, Station.lat, Station.eastVel, Station.northVel, ...
 Station.eastSig, Station.northSig, Station.corr, ...
 Station.other1, Station.tog, Station.name] = textread(fileName, '%f%f%f%f%f%f%f%d%d%s');
 
% New (fast) code:
fid = fopen(fileName,'rt');
c = textscan(fid, '%f%f%f%f%f%f%f%d%d%s');
fclose(fid);
fn = {'lon', 'lat', 'eastVel', 'northVel', 'eastSig', 'northSig', 'corr', 'other1', 'tog', 'name'};
Station = cell2struct(c,fn,2);

To improve the performance of the str2num calls, I differentiated between two sub-cases:

In some cases, str2num was simply used to round numeric input data to a certain numeric precision. I improved this by changing the str2num calls with corresponding calls to round (which accepts an optional precision argument since R2014b):

% Old (slow) code
Station.lon = str2num(num2str(Station.lon, '%3.3f'));
 
% New (fast) code
Station.lon = round(Station.lon,3);        % R2014b or newer
Station.lon = round(Station.lon*1e3)/1e3;  % R2014a or older

In other cases, str2num was used to convert strings into numeric values. This should normally be done using a textscan parameter but in this specific case this was complicated due to the way the data was formatted, which required parsing iterative blocks. Still, converting strings into numbers is far faster using sscanf than str2num. The down side is that str2num also works in certain edge-cases where sscanf doesn’t. For this reason, I created a utility function (str2num_fast.m) that uses sscanf where possible, and falls back to str2num in case of problems. I then simply replaced all calls to str2num in the code to str2num_fast:

% str2num_fast - faster alternative to str2num
function data = str2num_fast(str, numCols)
    try
        % Fast code:
        str = char(str);
        str(:,end+1) = ' ';
        data = sscanf(str','%f');
        if nargin>1 && ~isempty(numCols)
            data = reshape(data,numCols,[])';
        end
    catch
        % This is much slower...
        data = str2num(str);
    end
end

The result: loading a medium-sized data set, which used to take 5-6 minutes (and much longer for larger data sets), now takes less than 1 second, a speedup of x500. This may not seem important, but when you load different data sets continuously, it can mean the difference between a usable and an unusable program. Not bad for starters…

For many additional related techniques, read chapters 4 and 11 of my Accelerating MATLAB Performance book (string processing and I/O, respectively), or other performance-related articles on this website.

Displaying data

I now turned my attention to the graphic visualization aspects. As can be seen in the screenshot above, there are multiple layers of textual labels, arrows, lines and data points that can be added to the chart.

It turned out that in the interest of improved performance, the various checkboxes were designed such that they merely turned the visibility of the graphic components on and off. This does indeed improve performance in the specific use-case of checking and unchecking a specific checkbox. But in the general case, it significantly degrades performance by adding numerous graphic handles to the plot. By just checking 3 of these checkboxes (not all of them), I found that 37365 different graphic handles were created in the plot axes. That’s a HUGE number, and it’s no surprise that adding additional visualization layers, or zooming/panning the axes, became excruciatingly slow, even when the layers were turned off (i.e., made invisible). This is because Matlab’s internal graphics engine needs to manage all these handles, even when they are not visible.

The first rule of improving graphics performance is that except if the handles need to be frequently turned on/off, no graphic element should remain plotted if it is not visible. In our case, this meant that when a visualization layer’s checkbox is deselected, the corresponding handles are deleted, not made invisible (there is of course a throughput/latency tradeoff in the general case, between the recurring handle’s creation time and the performance impact of keeping numerous invisible handles):

% hCheckbox is the handle of the selected/deselected checkbox
% hPlotHandles is the list of corresponding plotted graphic handles
if get(hCheckbox, 'Value') == 0
   %set(hPlotHandles, 'Visible', 'off');  % Old (slow) code
   delete(hPlotHandles);  % Faster throughput in our use-case
else
   hPlotHandles = ...
end

A related aspect is that if the axes is zoomed-in (as is often the case in this specific GUI), then there is no need to plot any graphic element which is outside the axes limits:

% Old (slow) code:
text(lons, lats, labels);
 
% Much faster: limit the labels only to the visible axes area
hAxes = handle(gca);
validIdx = within(lons, hAxes.XLim) & within(lats, hAxes.YLim);
text(lons(validIdx), lats(validIdx), labels(validIdx,:));
 
function validIdx = within(data,limits)
    validIdx = data >= limits(1) & data <= limits(2);
end

Finally, in order to reduce the number of displayed graphic handles, we can unify the separate line segments into a single line that has NaN (or Inf) values interspaced between the segments. This is a very important technique, that enabled a reduction of ~7000 separate line handles into a single line, which improves both the line creation time and any subsequent axes action (e.g., zoom/pan). This is even faster than limiting the display to the axes limits (and yes, we could combine them by displaying a single line that has fewer data points that fit the axes limits, but the extra performance benefit would be negligible):

% Old (slow) code:
line([Segment.lon1'; Segment.lon2'], [Segment.lat1'; Segment.lat2']);
 
% Faster code: limit the display to the axes limits
hAxes = handle(gca);
lonLimits = hAxes.XLim;
latLimits = hAxes.YLim;
valid = (within(Segment.lon1,lonLimits) | within(Segment.lon2,lonLimits)) & ...
        (within(Segment.lat1,latLimits) | within(Segment.lat2,latLimits));
line([Segment.lon1(valid)', Segment.lon2(valid)'], ...
     [Segment.lat1(valid)', Segment.lat2(valid)']);
 
% New (fastest) code:
lats = [Segment.lon1'; Segment.lon2'; nan(1,numel(Segment.lon2)];
lons = [Segment.lat1'; Segment.lat2'; nan(1,numel(Segment.lat2))];
line(lats(:), lons(:));

The result: the time for displaying the slip-rate labels in the zoomed-in Australasia region in the screenshot above was reduced from 33 seconds to 0.6 secs; displaying the residual velocity vectors was reduced from 1.63 secs to 0.02 secs — speedups of x50-100. Again, not bad at all… The GUI is now fast enough to enable true interactivity. In Prof. Brendan Meade’s words:

[The GUI] is now tremendously fast with all arrow type visualizations! It’s amazing and enabling us to work with large scale data sets much more efficiently.​ Simply fantastic. Just awesome… It’s so fast on the load and showing the slip rates in zoom regions with large models almost instant! This is exactly what we were hoping for. This is really making a difference in terms of how fast we can do science!

The technique of converting multiple lines into a single line using NaNs was discussed last week by Mike Garrity. Users who are interested in additional ideas for improving Matlab graphics performance are encouraged to visit Mike’s blog. For many additional techniques, read chapter 10 of my Accelerating MATLAB Performance book, or other performance-related articles on this website.

Some other techniques for speeding up graphic objects creation that I’ve found useful over the years include:

  1. Avoid plotting non-visible elements, including elements that are outside the current axes limits, or have their Visible property set to ‘off’ or have a color that is the same as the axes background color.
  2. Avoid plotting overlapped elements, esp. those that are occluded by non-transparent patches, or lines having the same coordinates.
  3. Avoid using the scatter function with fewer than 100 data points – instead, duplicate these points so that scatter will work with more than 100 points, where vectorization kicks in (details), or even better: use line rather than scatter.
  4. Use low-level rather than high-level plotting functions – i.e., line instead of scatter/plot/plot3; surface instead of surf.
  5. Avoid creating straight line with multiple data points – instead, only keep the end-points for plotting such lines. I find that this is a very common use-case, which is often overlooked and could have a significant performance impact.
  6. Avoid using plot markers if possible, and use simple markers if this cannot be avoided. Various markers have different performance impacts in various situations, but ‘.’ and ‘o’ are typically faster than others.
  7. Use the plot function’s input triplets format, rather than multiple calls to plot. For example:
    plot(data1x,data1y,'r', data2x,data2y,'g', data3x,data3y,'b', ...);
  8. Set the axes properties to static values before plotting, in order to avoid run-time dynamic computation and update of things like the limits, tick-marks etc.
  9. Avoid creating legends or colorbars initially – let the user create them by clicking the corresponding toolbar icon if needed. Legends and colorbars take a second or more to create and can often be avoided in the initial display. If this cannot be avoided, then at least create static legends/colorbars.
  10. Only call drawnow once you’ve finished plotting. I’ve seen numerous cases where users call drawnow within the plotting loop and this has a horrendous performance impact. However, note that in some cases drawnow is very important (example1, example2).
  11. Generate the plot while the figure is hidden.
  12. Data-reduce the plotted data. We can program this ourselves, or use former MathWorker Tucker McClure’s reduce_plot utility (a POTW selection) to do it for us. Data reduction is especially important when displaying images that do not need to be zoomed-in.
  13. Cast image data to uint8 before using image or imagesc to display the image.
  14. Avoid clearing/deleting and then recreating the axes when we need to replot – instead, just delete the relevant axes children objects and replot in the existing axes.
  15. Avoid using the axes function to set the focus on a specific axes – instead, set the figure’s CurrentAxes property, or pass the axes handle directly to the plotting function.

Naturally, there are certain use-cases where applicative requirements might prevent using one or more of these techniques, but in the general case I find that following them improves performance.

Conclusions

Matlab is NOT inherently slow. It can be made to run much faster than many people assume, by simply using the built-in profiler tool, following several simple coding techniques and employing common sense. Too often I find that complains about Matlab’s speed stem from the fact that not even a minimal effort was invested in trying to follow these steps. The difference between an unoptimized and optimized Matlab code can be far larger in Matlab than in other programming languages, so Matlab users should invest more time optimizing their code than they would perhaps need to do in other programming environments. The potential benefits, as I’ve shown above and in my book, could be enormous.

MathWorks is constantly investing in making Matlab’s engine faster by default, and there is certainly room for improvement in certain aspects (e.g, OOP and HG2 performance). But there will always be room for human insight to optimize performance, and we should not neglect this. Moreover, we should not blame Matlab for our failure to invest even a minimal optimization effort. MathWorks cannot (of course) say this to their users, but I don’t have this limitation and I say it out loud: people should stop blaming MathWorks for everything. If you create a car with square wheels, don’t complain if it doesn’t drive as fast as you expect (even if its engine could indeed be improved). In this case, the customer is not always (or entirely) right.

Perhaps it’s just a matter of setting the user expectations straight: we do not expect Matlab to automatically solve our equations or generate the perfect engineering model. So too should we not expect Matlab to automatically run fast enough for our needs. Just as we expect to spend time to solve the scientific or engineering problem, so too should we spend a bit of time to optimize the code to run fast enough.

Luckily, there are numerous different ways in which we can improve Matlab’s performance. In fact, there are so many different ways to achieve our performance goals that we can take a pick based on aesthetic preferences and subjective experience: Some people use vectorization, others like parallelization, some others prefer to invest in smarter algorithms or faster hardware, others trade memory for performance or latency for throughput, still others display a GUI that just provides a faster impression with dynamic feedback. Even if one technique fails or is inapplicable, there are many other alternatives that we could try. Just use the profiler and some common sense and you are half-way there. Good luck!

Interested readers can find out more information about improving Matlab’s performance in my book “Accelerating MATLAB Performance” (CRC Press, 2014, ISBN 978-1482211290). If you already have this book, please be kind enough to post your feedback on it on Amazon (link), for the benefit of others.

 
Related posts:
  1. COM/ActiveX tips & tricks This article describes several little-known tips useful for COM / ActiveX programming in Matlab...
  2. Performance: accessing handle properties Handle object property access (get/set) performance can be significantly improved using dot-notation. ...
  3. Controlling plot data-tips Data-tips are an extremely useful plotting tool that can easily be controlled programmatically....
  4. Draggable plot data-tips Matlab's standard plot data-tips can be customized to enable dragging, without being limitted to be adjacent to their data-point. ...
 

JGraph in Matlab figures

$
0
0

I would like to introduce guest blogger Scott Koch. Scott is part of the development team at Eigenvector Research Inc., makers of PLS_Toolbox, a commercial chemometrics and multivariate data analysis toolbox. Today Scott will expand on JGraph, a Java-based open source graph visualization and diagramming library.

What is JGraph?

JGraph is an interactive Java-based diagramming and graph visualization library. The maintainers of JGraph have a product family that includes a Java Swing library (open-source), a JavaScript library (proprietary commercial), as well as other technologies. They call their product family “mxGraph”, and the Swing product specifically as “JGraphX”. The Swing library is available on GitHub and licensed under BSD. I will refer to the Swing library as JGraph, since that was the original library’s name until it was completely redesigned some years ago and renamed JGraphX. You can read additional information on JGraph and access various documentation alternatives in its README file.

Graphing is a powerful visualization tool that has not yet been integrated into the core Matlab product. I assume that this will be rectified by MathWorks in a future Matlab release. But until that time, or even later if you are still using R2015a or older, we do not have a solution in the core Matlab. In our toolbox product, we use a cleverly designed image to display a simple diagram, but I always thought it would be nice to have a “real” diagramming tool that was interactive and full-featured.

So, as a long time follower of Yair’s blog, I was thrilled to see his post several years ago about integrating Java libraries for charting and diagramming in Matlab figures. Unfortunately, my first attempts at getting JGraph to work in Matlab were not very successful. Thanks to a comment on that original post by Markus Behle, I was able to gain full access to JGraph in Matlab. Today’s post will show how we can use JGraph in Matlab.

Creating a new JGraph edge in a Matlab figure

Creating a new JGraph edge in a Matlab figure


Creating a simple graph

To install JGraph, first download the JGraph zip file, extract it in some folder, and then add the contained JGraph jar file to your Matlab’s Java path:

javaaddpath('jgraphx/lib/jgraphx.jar');

Having installed JGraph, we can now create graphs pretty easily in Matlab – see Yair’s original post for details.

Unfortunately, dragging doesn’t work and that’s a bummer. To enable dragging, create a custom graph component. I posted a followup comment showing how to do this. Note that the following code will work without creating a custom graph component but you won’t be able to drag (and drop).

In JGraph, a graph is made up of cells. A cell can be a vertex (node) or edge (connector). A cell can also hold other cells in a group.

Below is a code snippet similar to Yair’s original JGraph post, except we’ll use the custom graph component from above and add an additional vertex:

% Make the graph object
graph = javaObjectEDT('mymxGraph’);
 
% If not using custom graph component use the following
% graph = javaObjectEDT('com.mxgraph.view.mxGraph');
 
% Get the parent cell
parent = graph.getDefaultParent();
 
% Group update
graph.getModel().beginUpdate();
 
% Add some child cells
v1 = graph.insertVertex(parent, '', 'Hello', 240, 150, 80, 30);
v2 = graph.insertVertex(parent, '', 'World',  20,  20, 80, 30);
v3 = graph.insertVertex(parent, '', 'Vertex', 20, 150, 80, 30);
graph.insertEdge(parent, '', 'Edge', v1, v2);
 
graph.getModel().endUpdate();
 
% Get scrollpane
graphComponent = com.mxgraph.swing.mxGraphComponent(graph);
 
% Make a figure and stick the component on it
f = figure('units','pixels');
pos = get(f,'position'); 
mypanel = javax.swing.JPanel(java.awt.BorderLayout);
mypanel.add(graphComponent);
[obj, hcontainer] = javacomponent(mypanel, [0,0,pos(3:4)], f);
 
% Normalize units so resize works better
set(hcontainer,'Units','normalized');

We have 3 vertices and a single edge connecting two vertices. Each has a label. By default you can edit the labels and drag the vertices and edges. If you mouse over the middle of a vertex it will highlight, indicating that if you click and drag, you will be able to add an edge. Dragging the edge to another vertex will connect it. You can also resize and reposition vertices, as well as set edge labels, as shown in the animated image above.

Customizing graphs with HTML and CSS

If you look at online examples of JGraph, you can see there are lots of options for customizing your graph’s appearance. JGraph uses “styles” on vertices and edges, which are similar in concept to Cascading Style Sheets (CSS). You can add style information when you create a vertex, or by using the Graph Model. Rerun the code above with the following lines substituted:

v1 = graph.insertVertex(parent, '', 'Hello', 240, 150, 150, 150, 'rounded=1;');
v2 = graph.insertVertex(parent, '', 'World',  20,  20,  80,  30, 'rounded=1;strokeColor=blue;fillColor=lightblue');
v3 = graph.insertVertex(parent, '', 'Vertex', 20, 150,  80,  30, 'rounded=1;strokeColor=#000000;fillColor=#00CCFF;gradientColor=#333300;fontColor=white');
graph.insertEdge(parent, '', 'Edge', v1, v2, 'edgeStyle=elbowEdgeStyle;strokeColor=#5d65df;strokeWidth=2');

Simple JGraph with new styles

Simple JGraph with new styles

As Yair has taught us, most Java controls can render HTML. JGraph is no different, you just need to turn it on and add HTML to your label:

>> graph.setHtmlLabels(true);
>> htmltxt = ['<html><b>My HTML Vertex</b><hr noshade size=''3''>'...
              '<table border=1 cellspacing=1 cellpadding=5 '...
              'font color="#0000FF" FONT COLOR="black">'...
              '<tr><td><b>Style</b></td><td><b>Value</b></td></tr>'...
              '<tr><td>rounded</td><td>1</td></tr>'...
              '<tr><td>fillColor</td><td>yellow</td></tr>'...
              '</table></html>'];
>> v1.setValue(htmltxt)
>> graph.refresh

Vertex with HTML label

Vertex with HTML label

Adding a callback

Let’s add more functionality to our graph by adding a callback. To do this, we need to add a mouse-clicked callback to the graph scrollpane:

% Handle the scrollpane and add a click callback
scrollpanehandle = handle(graphComponent.getGraphControl, 'CallbackProperties');
set(scrollpanehandle, 'MouseClickedCallback', {@mouseClickCallback,f})

With a click callback in place, we can interrogate the click event and graph to determine what object is under the click. If the click happens over a vertex, a context menu is displayed allowing changing of the fill color.

function mouseClickCallback(Obj,eventData,myFig)
   %Graph mouse click callback
 
   %Extract graph object
   graphcomponent = Obj.getGraphContainer;
   graph = graphcomponent.getGraph;
   figpos = get(myFig,'position');
 
   %Get cell under click if it's there
   mycell = graphcomponent.getCellAt(eventData.getX,eventData.getY);
 
   if isempty(mycell) || mycell.isEdge
      %Clicking in open space
      return
   end
 
   if javax.swing.SwingUtilities.isRightMouseButton(eventData)
      mymenu = findobj(myFig,'tag','backgroundmenu');
      if isempty(mymenu)
         %Create context menu
         mymenu = uicontextmenu('tag','backgroundmenu');
         uimenu(mymenu,'Tag','graymenu','Label','Gray Background');
         uimenu(mymenu,'Tag','bluemenu','Label','Blue Background');
      end
 
      %Update callback with current cell object
      set(findobj(mymenu,'tag','graymenu'),'callback',{@changeFillColor,graph,mycell,'gray'});
      set(findobj(mymenu,'tag','bluemenu'),'callback',{@changeFillColor,graph,mycell,'blue'});
 
      %Show context menu
      set(mymenu,'position', [eventData.getX+8 figpos(4)-eventData.getY-8]);
      set(mymenu,'visible','on');
   end
end
 
function changeFillColor(Obj,eventData,varargin)
   % Change cell fill color
 
   %Pull graph object, current cell object, and new color value out of varargin
   mygraph = varargin{1};
   mycell = varargin{2};
   newcolor = varargin{3};
 
   %Get current style
   mystyle = char(mycell.getStyle);
 
   %Chop string into cells and locate fillcolor cell
   stylecell = strsplit(mystyle,';');
   fcloc = ~cellfun('isempty',strfind(stylecell,'fillColor='));
 
   %Make new fillcolor string
   switch newcolor
      case 'gray'
         newcolor = 'fillColor=#E8E8E8';
      case 'blue'
         newcolor = 'fillColor=#A9BCF5';
   end
 
   %Add new color into style
   if any(fcloc)
      stylecell{fcloc} = newcolor;
   else
      stylecell{end+1} = newcolor;
   end
 
   %Join styles back into single style string
   mystyle = strjoin(stylecell,';');
 
   %Set new style
   mygraph.getModel.setStyle(mycell,mystyle);
end

Conclusions

Hopefully this post gave enough information to get started making attractive and useful graphs with Matlab and JGraph. There is a lot of functionality included with JGraph and we’ve only scratched the surface today. I hope to have a future post discussing Groups, Drag and Drop, Layout Engines, and a few other topics that build upon what was discussed today.

Here are a few resources that could help you get started:

 
Related posts:
  1. JGraph and BDE This article shows how to display graph-theory diagrams in Matlab using several different Java libraries...
  2. Disabling menu entries in deployed docked figures Matlab's standard menu items can and should be removed from deployed docked figures. This article explains how. ...
  3. Docking figures in compiled applications Figures in compiled applications cannot officially be docked since R2008a, but this can be done using a simple undocumented trick....
  4. Matlab-Java interface using a static control The switchyard function design pattern can be very useful when setting Matlab callbacks to Java GUI controls. This article explains why and how....
 

Matlab designs by Tim Smith

$
0
0

Matlab has undergone significant facelifts in recent years: Matlab Mobile (first introduced in 2010, with various upgrades since), R2012b’s new desktop toolstrip, various Matlab Central’s website facelifts (example1, example2), R2014b’s new graphics system (HG2), Matlab on the Web (MOTW), and Matlab’s upcoming GUI framework (AppDesigner). That’s quite a lot of UI designs, new and overhauled, over a relatively short timespan.

Designer Tim Smith (designbytimsmith.com), is apparently responsible for many of the sleek UI designs, working with MathWorks’ internal User Experience (UX) team. Tim’s website showcases his work, philosophy, and design process for Matlab’s AppDesigner, Desktop toolstrip, Matlab Mobile, and Matlab on the Web.

I highly recommend reading what Tim has to say about these designs, as well as other designs that he created for other clients. Impressive work indeed.

Formerly a MathWorks visual designer, Tim left MathWorks in 2012 to join PayPal, and currently works at Google. designbytimsmith.com has no contact page, and Tim is apparently very secretive about his email address, which is a bit odd for someone who was the design lead for Google’s new Inbox product. Anyway, you can contact him via his LinkedIn profile or Google+ page.

If you want to get a feel for what Matlab might look like down the road, simply head over to Tim’s website.

Enjoy!

Various Tim Smith designs for AppDesigner's dial widget

Various Tim Smith designs for AppDesigner's dial widget

 
Related posts:
  1. Sliders in Matlab GUI Professional-looking slider controls can easily be integrated in Matlab GUI. ...
  2. Specialized Matlab plots The new MathWorks Plot Gallery provides access to some plotting examples on the File Exchange. Numerous others are available, extending the customizability of Matlab graphics. ...
  3. Matlab layout managers: uicontainer and relatives Matlab contains a few undocumented GUI layout managers, which greatly facilitate handling GUI components in dynamically-changing figures....
  4. Solving a Matlab hang problem A very common Matlab hang is apparently due to an internal timing problem that can easily be solved. ...
 

Callback functions performance

$
0
0

Matlab enables a variety of ways to define callbacks for asynchronous events (such as interactive GUI actions or timer invocations). We can provide a function handle, a cell-array (of function handle and extra parameters), and in some cases also a string that will be eval‘ed in run-time. For example:

hButton = uicontrol(..., 'Callback', @myCallbackFunc);  % function handle
hButton = uicontrol(..., 'Callback', {@myCallbackFunc,data1,data2});  % cell-array
hButton = uicontrol(..., 'Callback', 'disp clicked!');  % string to eval

The first format, function handle, is by far the most common in Matlab code. This format has two variant: we can specify the direct handle to the function (as in @myCallbackFunc), or we could use an anonymous function, like this:

hButton = uicontrol(..., 'Callback', @(h,e) myCallbackFunc(h,e));  % anonymous function handle

All Matlab callbacks accept two input args by default: the control’s handle (hButton in this example), and a struct or object that contain the event’s data in internal fields. In our anonymous function variant, we therefore defined a function that accepts two input args (h,e) and calls myCallbackFunc(h,e).

These two variants are functionally equivalent:

hButton = uicontrol(..., 'Callback', @myCallbackFunc);             % direct function handle
hButton = uicontrol(..., 'Callback', @(h,e) myCallbackFunc(h,e));  % anonymous function handle

In my experience, the anonymous function variant is widely used – I see it extensively in many of my consulting clients’ code. Unfortunately, there could be a huge performance penalty when using this variant compared to a direct function handle, which many people are simply not aware of. I believe that even many MathWorkers are not aware of this, based on a recent conversation I’ve had with someone in the know, as well as from the numerous usage examples in internal Matlab code: see the screenshot below for some examples; there are numerous others scattered throughout the Matlab code corpus.

Part of the reason for this penalty not being well known may be that Matlab’s Profiler does not directly attribute the overheads. Here is a typical screenshot:

Profiling anonymous callback function performance

Profiling anonymous callback function performance

In this example, a heavily-laden GUI figure window was closed, triggering multiple cleanup callbacks, most of them belonging to internal Matlab code. Closing the figure took a whopping 8 secs. As can be seen from the screenshot, the callbacks themselves only take ~0.66 secs, and an additional 7.4 secs (92% of the total) is unattributed to any specific line. Think about it for a moment: we can only really see what’s happening in 8% of the time – the Profiler provides no clue about the root cause of the remaining 92%.

The solution in this case was to notice that the callback was defined using an anonymous function, @(h,e)obj.tableDeletedCallbackFcn(e). Changing all such instances to @obj.tableDeletedCallbackFcn (the function interface naturally needed to change to accept h as the first input arg) drastically cut the processing time, since direct function handles do not carry the same performance overheads as anonymous functions. In this specific example, closing the figure window now became almost instantaneous (<1 sec).

Conclusions

There are several morals that I think can be gained from this:

  1. When we see unattributed time in the Profiler summary report, odds are high that this is due to function-call overheads. MathWorks have significantly reduced such overheads in the new R2015b (released last week), but anonymous [and to some degree also class methods] functions still carry a non-negligible invocation overheads that should be avoided if possible, by using direct [possibly non-MCOS] functions.
  2. Use direct function handles rather than anonymous function handles, wherever possible
  3. In the future, MathWorks will hopefully improve Matlab’s new engine (“LXE”) to automatically identify cases of @(h,e)func(h,e) and replace them with faster calls to @func, but in any case it would be wise to manually make this change in our code today. It would immediately improve readability, maintainability and performance, while still being entirely future-compatible.
  4. In the future, MathWorks may also possibly improve the overheads of anonymous function invocations. This is more tricky than the straight-forward lexical substitution above, because anonymous functions need to carry the run-time workspace with them. This is a little known and certainly very little-used fact, which means that in practice most usage patterns of anonymous functions can be statically analyzed and converted into much faster direct function handles that carry no run-time workspace info. This is indeed tricky, but it could directly improve performance of many Matlab programs that naively use anonymous functions.
  5. Matlab’s Profiler should really be improved to provide more information about unattributed time spent in internal Matlab code, to provide users clues that would help them reduce it. Some information could be gained by using the Profiler’s -detail builtin input args (which was documented until several releases ago, but then apparently became unsupported). I think that the Profiler should still be made to provide better insights in such cases.

Oh, and did I mention already the nice work MathWorks did with 15b’s LXE? Matlab’s JIT replacement was many years in the making, possibly since the mid 2000′s. We now see just the tip of the iceberg of this new engine: I hope that additional benefits will become apparent in future releases.

For a definitive benchmark of Matlab’s function-call overheads in various variants, readers are referred to Andrew Janke’s excellent utility (with some pre-15b usage results and analysis). Running this benchmark on my machine shows significant overhead reduction in function-call overheads in 15b in many (but not all) invocation types.

For those people wondering, 15b’s LXE does improve HG2′s performance, but just by a small bit – still not enough to offset the large performance hit of HG2 vs. HG1 in several key aspects. MathWorks is actively working to improve HG2′s performance, but unfortunately there is still no breakthrough as of 15b.

Additional details on various performance issues related to Matlab function calls (and graphics and anything else in Matlab) can be found in my recent book, Accelerating MATLAB Performance.

 
Related posts:
  1. Controlling callback re-entrancy Callback reentrancy is a major problem for frequently-fired events. Luckily, it can easily be solved....
  2. Continuous slider callback Matlab slider uicontrols do not enable a continuous-motion callback by default. This article explains how this can be achieved using undocumented features....
  3. uicontextmenu performance Matlab uicontextmenus are not automatically deleted with their associated objects, leading to leaks and slow-downs. ...
  4. Undocumented mouse pointer functions Matlab contains several well-documented functions and properties for the mouse pointer. However, some very-useful functions have remained undocumented and unsupported. This post details their usage....
 

Adding dynamic properties to graphic handles

$
0
0

A client recently asked me to extend one of Matlab’s built-in graphic containers (uiflowcontainer in this specific case) with automatic scrollbars that would enable the container to act as a scroll-panel. The basic idea would be to dynamically monitor the container’s contents and when it is determined that they overflow the container’s boundaries, then attach horizontal/vertical scrollbars to enable scrolling the contents into view:

Scrollable Matlab container

Scrollable Matlab container

This may sound simple, but there are actually quite a few undocumented hacks that make this possible, including listening to ObjectChildAdded/ObjectChildRemoved events, location/size/visibility events, layout changes etc. Maybe I’ll blog about it in some future article.

Today’s post is focused on a specific aspect of this project, attaching dynamic properties to the builtin uiflowcontainer, that would enable users to modify the container’s properties directly, as well as control aspects of the scrolling using the new properties: handles to the parent container, as well as the horizontal and vertical scrollbars, and even a new refresh() method.

The “textbook” approach to this would naturally be to create a new class that extends (inherits) uiflowcontainer and includes these new properties and methods. Unfortunately, for some reason that escapes my understanding, MathWorks saw fit to make all of its end-use graphic object classes Sealed, such that they cannot be extended by users. I did ask for this to be changed long ago, but the powers that be apparently decided that it’s better this way.

So the fallback would be to create our own dedicated class having all the new properties as well as those of the original container, and ensure that all the property values are synchronized in both directions. This is probably achievable, if you have a spare few days and a masochistic state of mind. Being the lazy bum and authority-rebel that I am, I decided to take an alternate approach that would simply add my new properties to the built-in container handle. The secret lies in the undocumented function schema.prop (for HG1, R2014a and older) and the fully-documented addprop function (for HG2, R2014b and newer).

In the examples below I use a panel, but this mechanism works equally well on any Matlab HG object: axes, lines, uicontrols, figures, etc.

HG2 – addprop function

The addprop function is actually a public method of the dynamicprops class. Both the dynamicprops class as well as its addprop function are fully documented. What is NOT documented, as far as I could tell, is that all of Matlab’s builtin handle graphics objects indirectly inherit dynamicprops, via matlab.graphics.Graphics, which is a high-level superclass for all HG objects. The bottom line is that we can dynamically add run-time properties to any HG object, without affecting any other object. In other words, the new properties will only be added to the handles that we specifically request, and not to any others. This suits me just fine:

hProp = addprop(hPanel, 'hHorizontalScrollBar');
hPanel.hHorizontalScrollBar = hMyScrollbar;
hProp.SetAccess = 'private';  % make this property read-only

The new property hHorizontalScrollBar is now added to the hPanel handle, and can be accessed just like any other read-only property. For example:

>> get(hPanel, 'hHorizontalScrollBar')
ans =
    JavaWrapper

>> hPanel.hHorizontalScrollBar
ans =
    JavaWrapper

>> hPanel.hHorizontalScrollBar = 123
You cannot set the read-only property 'hHorizontalScrollBar' of UIFlowContainer.

Adding new methods is more tricky, since we do not have a corresponding addmethod function. The trick I used was to create a new property having the requested new method’s name, and set its read-only value to a handle of the requested function. For example:

hProp = addprop(hPanel, 'refresh');
hPanel.refresh = @myRefreshFunc;
hProp.SetAccess = 'private';  % make this property read-only

We can then invoke the new refresh “method” using the familiar dot-notation:

hPanel.refresh();

Note: if you ever need to modify the initial value in your code, you should revert the property’s SetAccess meta-property to 'public' before Matlab will enable you to modify the value:

try
    % This will raise an exception if the property already exists
    hProp = addprop(hPanel, propName);
catch
    % Property already exists - find it and set its access to public
    hProp = findprop(hPanel, propName);
    hProp.SetAccess = 'public';
end
hPanel.(propName) = newValue;

HG1 – schema.prop function

In HG1 (R2014a and earlier), we can use the undocumented schema.prop function to add a new property to any HG handle (which is a numeric value in HG1). Donn Shull wrote about schema.prop back in 2011, as part of his series of articles on UDD (Unified Data Dictionary, MCOS’s precursor). In fact, schema.prop is so useful that it has its own blog tag here and appears in no less than 15 separate articles (excluding today). With HG2′s debut 2 years ago, MathWorks tried very hard to rid the Matlab code corpus of all the legacy schema-based, replacing most major functionalities with MCOS-based HG2 code. But so far it has proven impossible to get rid of schema completely, and so schema code is still used extensively in Matlab to this day (R2015b). Search your Matlab path for “schema.prop” and see for yourself.

Anyway, the basic syntax is this:

hProp = schema.prop(hPanel, propName, 'mxArray');

The 'mxArray' specifies that the new property can accept any data type. We can limit the property to only accept certain types of data by specifying a less-generic data type, among those recognized by UDD (details).

Note that the meta-properties of the returned hProp are somewhat different from those of HG2′s hProp. Taking this into account, here is a unified function that adds/updates a new property (with optional initial value) to any HG1/HG2 object:

function addProp(hObject, propName, initialValue, isReadOnly)
    try
        hProp = addprop(hObject, propName);  % HG2
    catch
        try
            hProp = schema.prop(hObject, propName, 'mxArray');  % HG1
        catch
            hProp = findprop(hObject, propName);
        end
    end
    if nargin > 2
        try
            hProp.SetAccess = 'public';  % HG2
        catch
            hProp.AccessFlags.PublicSet = 'on';  % HG1
        end
        hObject.(propName) = initialValue;
    end
    if nargin > 3 && isReadOnly
        try
            % Set the property as read-only
            hProp.SetAccess = 'private';  % HG2
        catch
            hProp.AccessFlags.PublicSet = 'off';  % HG1
        end
    end
end

 
Related posts:
  1. Performance: accessing handle properties Handle object property access (get/set) performance can be significantly improved using dot-notation. ...
  2. UDD Properties UDD provides a very convenient way to add customizable properties to existing Matlab object handles...
  3. getundoc – get undocumented object properties getundoc is a very simple utility that displays the hidden (undocumented) properties of a specified handle object....
  4. Customizing axes part 4 – additional properties Matlab HG2 axes can be customized in many different ways. This article explains some of the undocumented aspects. ...
 

Font selection components

$
0
0

I’ve written here in the past about how Matlab includes multiple alternatives for color selection, plot-type selection and date selection components, that can easily be integrated in Matlab figures (GUI). Today, I will show that Matlab also contains various built-in components for font selection.

These components are used by Matlab itself, integrated within the Preferences panel, print setup popup, property inspector window and so on. In most cases the components have remained unchanged for multiple releases, some existing in Matlab releases for the past decade or more. However, since internal components can change without prior notice, there is no assurance that any particular component will continue to be available in future Matlab releases.

Readers who are interested in additional details about the components mentioned in today’s post are referred to sections 3.3.3 and 5.5.2 of my book, Undocumented Secrets of MATLAB-Java Programming.

uisetfont

The only documented font-selection alternative in Matlab is uisetfont, which presents a popup dialog window that returns the selected font properties in a simple Matlab struct:

>> font = uisetfont
font = 
      FontName: 'Arial'
    FontWeight: 'normal'
     FontAngle: 'normal'
     FontUnits: 'points'
      FontSize: 10

Matlab's uisetfont dialog

Matlab's uisetfont dialog


The main drawback of uisetfont is the fact that it displays a separate non-resizable modal dialog window. We cannot embed uisetfont within our own panel, integrated in our GUI figure.

DesktopFontPicker

DesktopFontPicker is a Swing component that presents a font selection panel that can easily be inserted into any Matlab GUI container (figure, panel or tab) using the javacomponent function:

font = java.awt.Font('Tahoma',java.awt.Font.PLAIN, 11);
jFontPanel = com.mathworks.widgets.DesktopFontPicker(true, font);
[jhPanel,hContainer] = javacomponent(jFontPanel, [10,10,250,170], gcf);

DesktopFontPicker panel

DesktopFontPicker panel

Instead of the “Use desktop font” label, we can use our own label:

jFontPanel.setUseDesktopFontLabel('Use Yair''s standard font...')

Non-standard DesktopFontPicker panel

Non-standard DesktopFontPicker panel

To extract the selected font, use one of the following methods provided by DesktopFontPicker:

jFont = jFontPanel.getSelectedFont();  % returns a java.awt.Font object
flag = jFontPanel.getUseDesktopFont();  % true if top radio-button is selected; false if custom font is selected

FontPrefsPanel

The builtin com.mathworks.mlwidgets.prefs.FontPrefsPanel class is used in Matlab to display the font preferences panel in the Preferences window. We can integrate it directly in our GUI:

jFontPanel=com.mathworks.mlwidgets.prefs.FontPrefsPanel(java.awt.Dimension);
[jhPanel,hContainer] = javacomponent(jFontPanel, [1,1,500,470], gcf);

Using this class is admittedly more cumbersome than DesktopFontPicker and I would not recommend using it in practice.

FontPicker

Font selection can also be shown with drop-downs (combo-boxes), rather than with lists as in DesktopFontPicker, FontPrefsPanel, or uisetfont. Use of drop-downs significantly reduces the display “real-estate” required by the control. This is useful in forms where the font selection is only one of several user-configurable options, and where enough space must be reserved for other configuration controls. We can do this using the com.mathworks.widgets.fonts.FontPicker class.

Up until Matlab release R2010a, FontPicker‘s constructor accepted optional parameters of a pre-selected font (a java.awt.Font object), an optional boolean flag indicating whether to display sample text using the selected font, an optional layout indicator, and optional list of selectable font names. Several screenshots of different parameter combinations are shown below:

import com.mathworks.widgets.fonts.FontPicker
jFontPicker = FontPicker(font, sampleFlag, layout);
[hjFontPicker, hContainer] = javacomponent(jFontPicker, position, gcf);
FontPickerFontPickerFontPicker
font=[]java.awt.Font('Tahoma', java.awt.Font.PLAIN, 8 )[]
sampleFlag=falsefalsetrue
layout=FontPicker.GRID_LAYOUT (=1)FontPicker.LONG_LAYOUT (=2)FontPicker.LONG_LAYOUT (=2)
position=[10,200,140,40][10,200,225,20][10,200,225,80]

As before, the selected font can be retrieved using jFontPicker.getSelectedFont().

In Matlab release R2010b, FontPicker‘s interface changed, and the above code no longer works. This highlights a common pitfall in future-compatibility of internal components: even when the components remain, their interface sometimes changes. Here is the new code format, starting with R2010b:

jLayout = javaMethod('valueOf', 'com.mathworks.widgets.fonts.FontPicker$Layout', 'WIDE_WITH_SAMPLE');  % options: COMPACT, WIDE, WIDE_WITH_SAMPLE
jFont = java.awt.Font('Tahoma', java.awt.Font.PLAIN, 10);  % initial font to display (may not be [])
jFontPicker = com.mathworks.widgets.fonts.FontPicker(jFont, jLayout);
jFontPanel = jFontPicker.getComponent;
[jhPanel,hContainer] = javacomponent(jFontPanel, [10,10,250,120], gcf);

FontChooserPanel

As a final alternative for font selection, we can use the JIDE font-selection component. This component has two variants: as a drop-down/combo-box (com.jidesoft.combobox.FontComboBox) and as a standard JPanel (com.jidesoft.combobox.FontChooserPanel):

jFont = java.awt.Font('arial black',java.awt.Font.PLAIN, 8);
jFontPicker = com.jidesoft.combobox.FontComboBox(jFont);
[hjFontPicker, hContainer] = javacomponent(jFontPicker, position, gcf);
set(hjFontPicker, 'ItemStateChangedCallback', @myCallbackFunction);

JIDE's FontComboBox

JIDE's FontComboBox

Within the callback function, use getSelectedFont() to retrieve the updated font (again, a java.awt.Font object). There is also a corresponding setSelectedFont(font) to programmatically update the control with the specified Font object.

The combo-box presents a FontChooserPanel, which can be accessed (via the PopupPanel property or the corresponding getPopupPanel() method) after it has been initially created. Thereafter, the panel can be customized. For example, the preview text can be modified via the panel’s PreviewText property (or the setPreviewText(text) method).

The same FontChooserPanel can also be displayed as a stand-alone font-selection panel, unrelated to any combo-box. Different GUI requirements might prefer using a compact combo-box approach, or the larger stand-alone panel.

This combo-box/panel duality is a common feature of JIDE controls. I have previously shown it in my color selection components and date selection components articles.

popupmenu uicontrol

As another example of using a font-selection drop-down (combo-box), we can use a standard Matlab popupmenu uicontrol, setting its String property value to a cell-array containing the supported system’s fonts (as returned by the listfonts function). A nice twist here is to use the undocumented trick that all Matlab uicontrols inherently support HTML to list each of the fonts in their respective font style:

fontStr = @(font) ['<html><font face="' font '">' font '</font></html>'];
htmlStr = cellfun(fontStr, listfonts, 'uniform',false);
uicontrol('style','popupmenu', 'string',htmlStr, 'pos',[20,350,100,20]);

HTML-rendered fonts popup menu

HTML-rendered fonts popup menu

Note that we could also use a listbox uicontrol using the same code.

Austria visit, 11-15 October, 2015

I will be travelling to clients in Austria next week, between October 11-15. If you are in Austria and wish to meet me to discuss how I could bring value to your work, then please email me (altmany at gmail).

 
Related posts:
  1. Date selection components The JIDE package, pre-bundled in Matlab, contains several GUI controls for selecting dates - this article explains how they can be used...
  2. Color selection components Matlab has several internal color-selection components that can easily be integrated in Matlab GUI...
  3. Plot-type selection components Several built-in components enable programmatic plot-type selection in Matlab GUI - this article explains how...
  4. Setting status-bar components Matlab status-bars are Java containers in which we can add GUI controls such as progress-bars, not just simple text labels...
 

Hyperlink text labels

$
0
0

It is often useful to include hyperlinked text labels in GUIs. Such labels provide single-click access to important functionality, improve branding, and are non-intrusive action controls having a lower visual impact than a full-blown button. There are several ways that we can display such hyperlinks in Matlab GUIs, and today I will show one of my favorites.

The basic idea is to create a Java text label control whose label displays an HTML link. The control is modified to change the mouse cursor when it hovers over the hyperlink, and a mouse-click callback is set to open the hyperlink target in the system browser:

hyperlink text label

hyperlink text label

% Create and display the text label
url = 'UndocumentedMatlab.com';
labelStr = ['<html>More info: <a href="">' url '</a></html>'];
jLabel = javaObjectEDT('javax.swing.JLabel', labelStr);
[hjLabel,hContainer] = javacomponent(jLabel, [10,10,250,20], gcf);
 
% Modify the mouse cursor when hovering on the label
hjLabel.setCursor(java.awt.Cursor.getPredefinedCursor(java.awt.Cursor.HAND_CURSOR));
 
% Set the label's tooltip
hjLabel.setToolTipText(['Visit the ' url ' website']);
 
% Set the mouse-click callback
set(hjLabel, 'MouseClickedCallback', @(h,e)web(['http://' url], '-browser'))

Note the visual illusion here: we do not directly click the hyperlink (note that its href is empty), but rather the label control. The end-result is the same.

Also note that this technique could be used to easily display clickable icons/images, including animated and transparent GIFs, by simply setting the label’s HTML string to display the relevant image. I have already shown how to do this in another post. Uses could range from clickable logo images to clickable help icons.

We could also use a flat (borderless) button. I have already posted related articles about button customizations in Matlab GUIs (here, here and here). In fact, I have already shown how we can use borderless buttons in Matlab axes to display a non-obtrusive control for controlling plot properties. The code would be very similar to the above, except that we would use a JButton rather than a JLabel, and also need to setBorder([]) and similar button-specific modifications. Buttons have a bit more functionality and customizability than simple text labels; the appearance would be the same, but the extra customizability may be handy in very special cases, although not for most use-cases.

One of the benefits of using either JLabels or JButtons is that they enable multiple callbacks (e.g., FocusGained,FocusLost) and properties (e.g., VerticalAlignment,ToolTipText) that the standard Matlab text uicontrol does not provide (not to mention their builtin ability to display HTML, which Matlab’s uicontrol text labels do not posses).

 
Related posts:
  1. Customizing Matlab labels Matlab's text uicontrol is not very customizable, and does not support HTML or Tex formatting. This article shows how to display HTML labels in Matlab and some undocumented customizations...
  2. Images in Matlab uicontrols & labels Images can be added to Matlab controls and labels in a variety of manners, documented and undocumented. ...
  3. Syntax highlighted labels & panels Syntax-highlighted labels and edit-boxes can easily be displayed in Matlab GUI - this article explains how. ...
  4. Setting status-bar text The Matlab desktop and figure windows have a usable statusbar which can only be set using undocumented methods. This post shows how to set the status-bar text....
 

Figure keypress modifiers

$
0
0

Matlab figures have a documented property called SelectionType that returns information about keypress modifiers such as or that were pressed during mouse clicks. Using this property has several drawbacks IMHO:

  • The reported SelectionType value is 'extend' for shift-clicks and 'alt' for ctrl-clicks, not very intuitive.
  • There is no support for alt-clicks, which are reported as regular ('normal') mouse clicks. In fact, 'alt' is reported for ctrl-clicks rather than for alt-clicks, which is very confusing.
  • There is no support for modifier combinations such as ctrl+shift-click. These again are reported as regular ('normal') mouse clicks.
  • SelectionType is only updated for mouse clicks, not for keyboard clicks. This again is very confusing. To extract the keypress modifier for key-click events we need to get the Modifier property of the key-press event, and this returns a cell-array of strings (e.g., {'shift','control','alt'}). Note that in this case, unlike SelectionType, the modifier names are as expected, alt-clicks is recognised and so are modifier combinations.
% Documented: we need to get the modifier data in two different manners
set(gcf, 'WindowButtonDownFcn', @(h,e) disp(get(gcf,'SelectionType')));  % mouse clicks: displays a single string: 'normal','alt','extend' or 'open'
set(gcf, 'WindowKeyPressFcn',   @(h,e) disp(e.Modifier));  % keyboard clicks: displays a cell-array of strings, e.g. {'shift','control','alt'}

The inconsistency between the functionality for mouse and keyboard clicks, and the limitations of the SelectionType property, are striking and most annoying. Some might say that it’s been like this for the past 2 decades so Matlab users have probably gotten used to it by now. But I must admit that after over 2 decades with Matlab I still need to refer to the documentation to figure out the correct behavior. Maybe that’s because I’m getting old, or maybe it means that the behavior is indeed not as intuitive as one could hope for.

For this reason, I was very happy to discover several years ago that there was a much simpler, easier and consistent solution, although (alas) undocumented. The trick is to simply query the undocumented hidden figure property CurrentModifier: CurrentModifier is updated during both mouse and keyboard clicks, in the same consistent manner, in both cases returning the same cell-array of strings as the Modifier property of the standard key-press event:

% Undocumented: the following displays a cell-array of strings having a consistent format, e.g. {'shift','control','alt'}
set(gcf, 'WindowButtonDownFcn', @(h,e) disp(get(gcf,'CurrentModifier')));  % mouse clicks
set(gcf, 'WindowKeyPressFcn',   @(h,e) disp(get(gcf,'CurrentModifier')));  % keyboard clicks

Checking whether any modifier was pressed becomes trivial:

modifiers = get(gcf,'CurrentModifier');
wasShiftPressed = ismember('shift',   modifiers);  % true/false
wasCtrlPressed  = ismember('control', modifiers);  % true/false
wasAltPressed   = ismember('alt',     modifiers);  % true/false

Hurrah for simplicity and consistency!

Note that despite the fact that CurrentModifier is hidden and undocumented, it has existed as-is for many years, and even survived (unchanged) the major transition from HG1 to HG2 in R2014b. This has to mean that MathWorks recognized the importance of CurrentModifier and took the deliberate decision (and associate dev effort) to preserve it. So why wasn’t this useful property made documented ages ago, or at the very least at the HG2 transition point? I don’t have a good answer to this riddle.

 
Related posts:
  1. Minimize/maximize figure window Matlab figure windows can easily be maximized, minimized and restored using a bit of undocumented magic powder...
  2. Customizing figure toolbar background Setting the figure toolbar's background color can easily be done using just a tiny bit of Java magic powder. This article explains how. ...
  3. Blurred Matlab figure window Matlab figure windows can be blurred using a semi-transparent overlaid window - this article explains how...
  4. uicontrol side-effect: removing figure toolbar Matlab's built-in uicontrol function has a side-effect of removing the figure toolbar. This was undocumented until lately. This article describes the side-effect behavior and how to fix it....
 

Graphic sizing in Matlab R2015b

$
0
0

I would like to introduce Daniel Dolan of Sandia National Laboratories. Dan works on a variety of data analysis projects in Matlab, and is an active lurker on MATLAB Central. Dan has a habit of finding interesting bugs for the Mac version of Matlab. Today he will discuss graphic sizing in Matlab and important changes that occurred in release R2015b.

Matlab-generated graphics are often not displayed at their requested size. This problem has been known for some time and has a well-known solution: setting the root object’s ScreenPixelsPerInch property to the display’s actual DPI (dots per inch) value. Release R2015b no longer supports this solution, creating problems for publication graphics and general readability.

Physical sizing in R2015a vs. R2015b (click for full-size)

Physical sizing in R2015a vs. R2015b (click for full-size)


Physical sizing

Matlab supports graphic sizing in various physical units: inches, centimeters, and points. For example:

figure; axes('Box','on', 'Units','inches','Position',[0.3 0.3 4 4]);

requests to display an axes having square sizes measuring exactly 4″ (101.6 mm) each. It is evident, however, that the displayed axes is smaller than 4″. The mismatch between requested and physical size depends on the display and operating system — go ahead, try it on your system. The problem is particularly severe on Mac laptops, presumably even worse for those with Retina displays.

The problem is that Matlab cannot determine pixel size, which varies from one display to the other. Generating a figure spanning a particular number of pixels (e.g., 1024 x 768) is easy, but absolute physical units requires a conversion factor called ScreenPixelsPerInch, which is a root property (see related post on setting/getting default graphics property values):

DPI = 110;                             % dots per inch for my 27" Apple Cinema Display
set(0,    'ScreenPixelsPerInch',DPI);  % all releases prior to R2015b
set(groot,'ScreenPixelsPerInch',DPI);  % R2014b through R2015a

DPI values tend to be higher for laptops, usually in the 120-130 range. Retina displays are supposed to be >300 DPI, but I have not been able to test that myself.

There are several ways to determine the correct DPI setting for a particular display. It may be available in the hardware specifications, and it can be calculated from the diagonal size and the number of pixels. Unfortunately these methods are not always reliable. If you really care about physical sizing, the best approach is to actually calibrate your display. There are tools for doing this at Matlab Central, but it’s not hard to do manually:

  • Create a figure.
  • Manually resize the figure to match a convenient width. I often use a piece of US letter paper as 8.5″ guide on the display.
  • Determine the width of the figure in pixels:
    set(gcf,'Units','pixels');
    pos = get(gcf,'Position');
    width = 8.5; % inches
    DPI = pos(3) / width;

I usually apply the DPI settings in my startup file so that Matlab begins with a calibrated display.

What changed in 2015b?

ScreenPixelsPerInch is a read-only property in R2015b, so display calibration no longer works. The following sequence of commands:

figure('Units','inches', 'PaperPositionMode','auto', 'Position',[0 0 4 4]);
set(gcf, 'MenuBar','none', 'ToolBar','none', 'DockControls','off', 'NumberTitle','off');
axes('FontUnits','points', 'FontSize',10);
image

now renders differently in R2015b than does for a calibrated display in R2015a. Differences between the two outputs are shown in the screenshot at the top of this post. The grid behind the figures was rendered at 8.5″ x 8.5″ inches on my display; if your browser’s zoom level isn’t 100%, it may appear larger or smaller.

A side effect of improper graphic sizing is that text is difficult to read — the uncalibrated axes labels are clearly smaller than 10 points. These examples were rendered on ~110 DPI display. Matlab assumes that Macs use 72 DPI (96 DPI on Windows), so graphics appear at 65% of the request size.

The loss of ScreenPixelsPerInch as an adjustable setting strongly affects anyone using Matlab for publication graphics. Scientific and engineering journals are extremly strict about figure widths. With a calibrated screen, figure appear exactly as they will when printed to a file (usually EPS or PDF). Figures are often made as small as possible to and densely packed to save journal space, and accurate sized display helps the author determine legibility. Displaying accurately sized graphics is very difficult in R2015b, which is unfortunate given the many enhancements in this release.

Developers who create graphical interfaces for other users should also care about this change. A common complaint I get is that text and control labels is too small to easily read. Screen calibration deals with this problem, but this option is no longer available.

Where do we go from here?

I reported the above issues to the Mathworks several months ago. It does not appear as a formal bug, but technical support is aware of the problem. The change is part of the “DPI aware” nature of release R2015b. So far I have found no evidence this release is any more aware of pixel size than previous releases, but my experience is limited to non-Retina Macs. I welcome input from users on other operating systems, particularly those with high-resolution displays.

To be fair, correct physical sizing is not an easy across the many platforms that Matlab runs on. Display resolution is particularly tricky when it changes during a Matlab session, such as when computer is connector to projector/television or a laptop is connected to a docking station.

Thankfully, printed graphic sizes are rendered correctly when a figure’s PaperPositionMode property is 'auto'. Many users can (and will) ignore the display problem if they aren’t dealing with strict size requirements and text legibility isn’t too bad. Some users may be willing to periodically print publication figures to externally verify sizing, but this breaks the interactive nature of Matlab figures.

A potential work around is the creating of a new figure class that oversizes figures (as needed) to account for a particular display. I started working on such a class, but the problem is more complicated than one might think:

  • Child objects (axes, uicontrols, etc.) also must be resized if they are based on physical units.
  • Resized objects must be temporarily restored to their original size for printing, and new objects must be tracked whenever they are added.
  • Figure resolution may need to be changed when moving to different computer systems.

These capabilities are quite possible to implement, but this is a complicated solution to problem that was once easy to fix.

Retina displays don’t suffer as badly as one might think from the DPI mismatch. Even though the display specification may be greater than 200 DPI, OS X and/or Matlab must perform some intermediate size transformations. The effective DPI in R2015a is 110-120 for 13-15″ MacBook Pro laptops (at the default resolution). Objected sized with physical units still appear smaller than they should (~72/110), but not as small as I expected (<72/200).Effect pixel size can also be changed by switching between different monitor scalings. This isn't entirely surprising, but it can lead to some interesting results because Matlab only reads these settings at startup. Changing the display scaling during a session can cause square figures to appear rectangular. Also, the effective DPI changes for setting: I could reach values of ~60-110 DPI on an Apple Cinema Display.So where does this leave us? Display calibration was always a finicky matter, but at least in principle one could make graphics appear exactly the same size on two different displays. Now it seems that sizing is completely variable between operation systems, displays, and display settings. For publication graphics, there will almost always be a disconnect between figure size on the screen and the printed output; some iteration may be needed to ensure everything looks right in the finished output. For graphical interfaces, font sizes may need to generated in normalized units and then converted to pixels (to avoid resizing).Physical accuracy may not be important for non-publication figures, but the issue of text legibility remains. Some text objects--such as axes and tick labels--can easily be resized because the parent axes automatically adjusts itself as needed. Free floating text objects and uincontrols are much more difficult to deal with. Controls are often sized around the extent of their text label, so changing font sizes may require changes to the control position; adjacent controls may overlap after resizing for text clarity. Normalized units partially solve this problem, but their effect on uicontrols is not always desirable: do you really want push buttons to get larger/smaller when the figure is resized?Can you think of a better workaround to this problem? If so, then please post a comment below. I will be very happy to hear your ideas, as I'm sure others who have high resolution displays would as well.(cross-reference: CSSM newsgroup post)

Viewing all 75 articles
Browse latest View live